
By Country
Beginner's Guide to Deriv Bots South Africa No Download
Learn how beginners use Deriv Bots South Africa with browser tools and ZAR accounts. Start trading digits with zero downloads. Read the guide today.
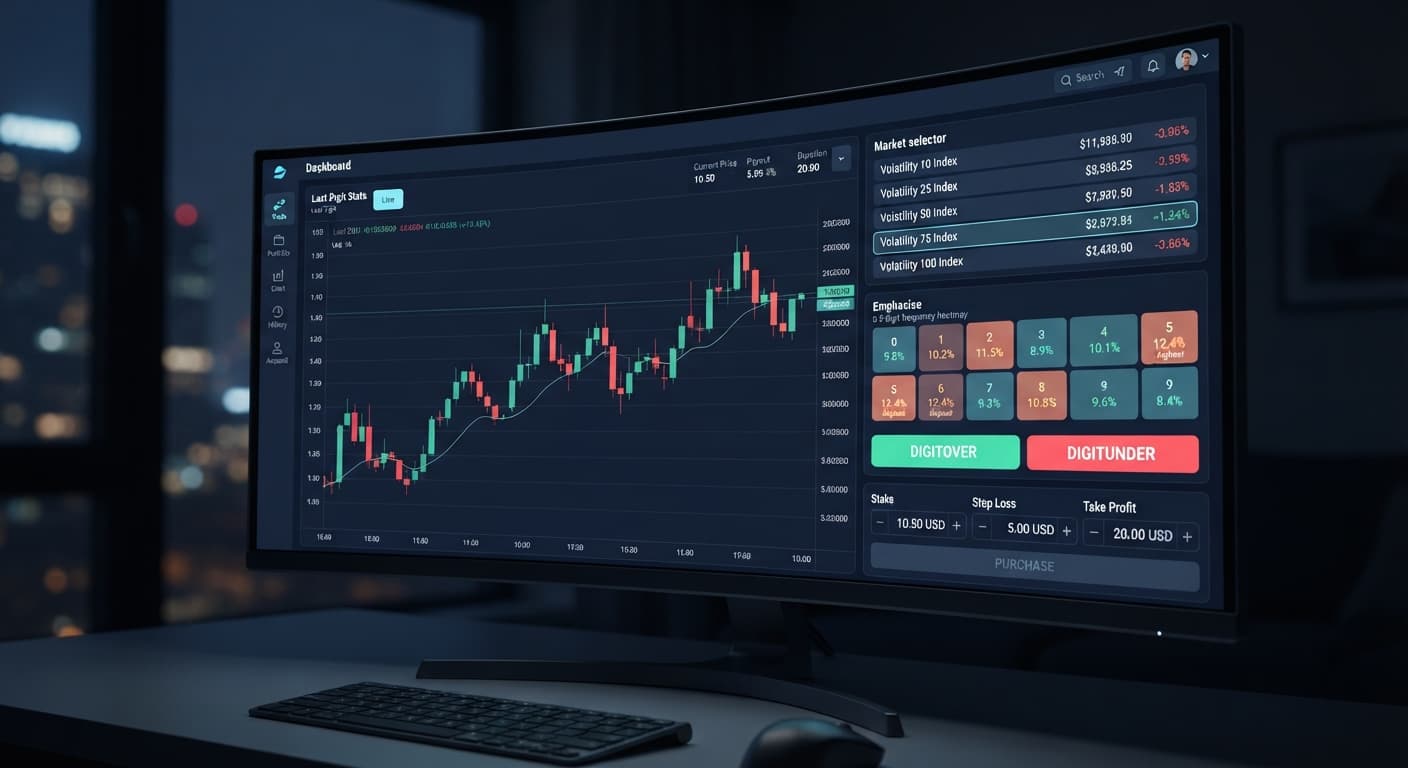
Traders searching for binary bots kenya use free browser-based analysers on BinaryBot.live to inspect real-time tick statistics on Deriv synthetic indices before risking actual capital. By testing DIGITOVER and DIGITUNDER barriers against live historical data, you can evaluate market performance on a virtual balance before committing KES through M-Pesa. This workflow lets you verify contract timing and barrier positioning without exposing your bankroll to live market conditions.
When setting up automated trading scripts in East Africa, jumping straight into real money transactions is a fast way to drain a account balance. Getting comfortable with browser-based tools gives you a full view of contract outcomes without taking on unneeded risk. You can review full platform features directly on the Deriv bots Kenya regional hub.
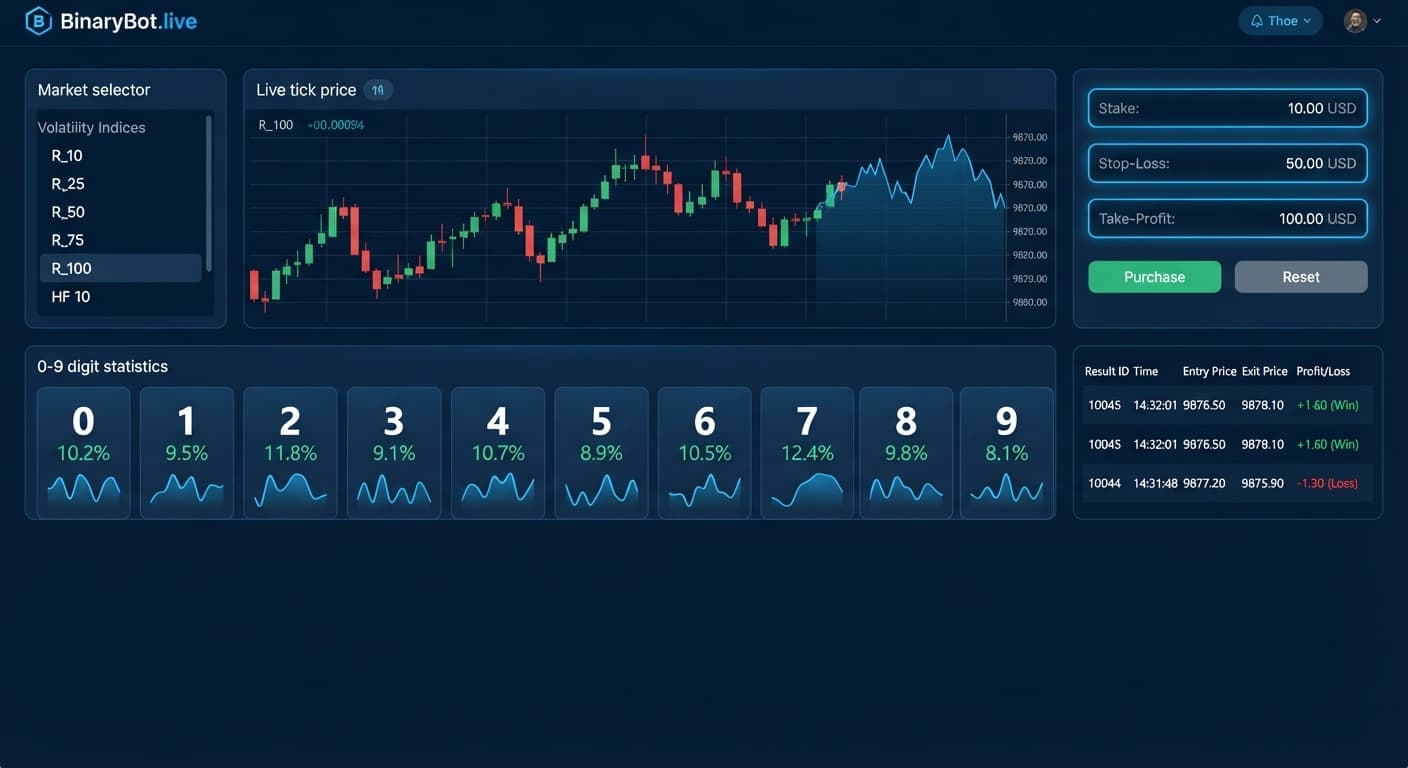
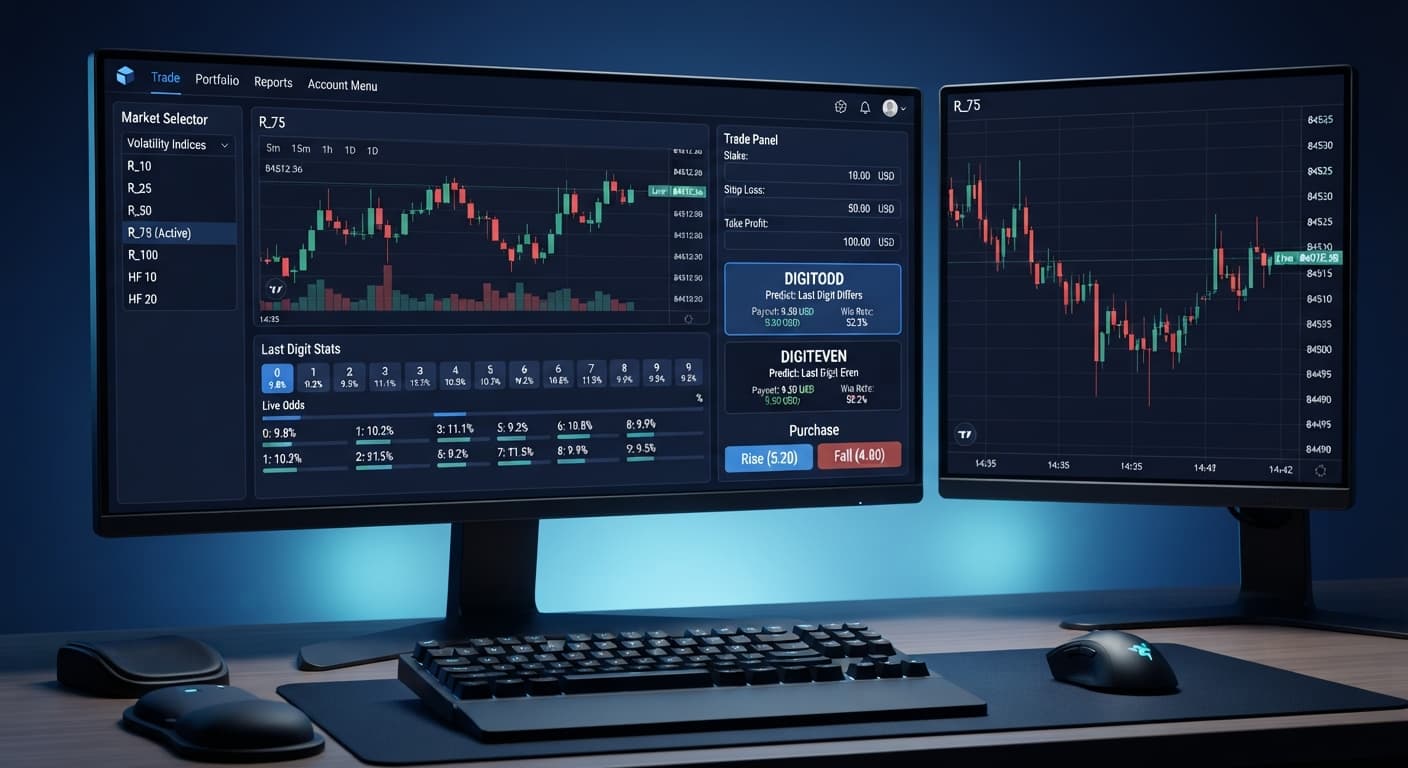
When you open the LDP Analyzer Pro dashboard or the standard LDP Analyzer tool, the interface divides your screen into distinct operational zones. You don't need to install software or configure browser extensions. The portal connects directly to Deriv over their official API using the access credentials you supply.
+-----------------------------------------------------------------------+
|  [ API Token Input ]  [ Market: Volatility 75 ]  [ Ticks: 500 ]       |
+-----------------------------------------------------------------------+
|  DIGIT DISTRIBUTION MATRIX                                            |
|  0: 9.6% | 1: 10.4% | 2: 6.8% | 3: 10.2% | 4: 9.8%                    |
|  5: 10.6%| 6: 9.4%  | 7: 13.6%| 8: 10.4% | 9: 9.2%                    |
+-----------------------------------------------------------------------+
|  STRATEGY CONFIGURATION                                               |
|  Contract Type: [ DIGITOVER ]    Prediction Barrier: [ 2 ]           |
|  Stake: [ $1.00 ]  | Take Profit: [ $10.00 ] | Stop Loss: [ $20.00 ]    |
+-----------------------------------------------------------------------+
|  [ START BOT ]   [ STOP BOT ]   |  Live Log: Connected to API...    |
+-----------------------------------------------------------------------+
Here's what each panel on your dashboard manages and why it matters:
Log into your Deriv profile, open your account settings, and locate the API Token menu. Create a new token with Read and Trade permissions. Copy the string of letters and numbers generated by the site.
Paste that key into the token field on BinaryBot.live. The system verifies the credential with Deriv and displays your current account balance at the top of the interface. Always start with your Virtual Account selected so your testing uses demo funds.
Pick your target market from the index list. Volatility 75 Index is popular among local traders because it updates every single second, giving you a continuous stream of fresh tick data.
Set your statistical calculation window. A window of 500 ticks balances long-term digit averages with short-term variance. Smaller windows like 50 ticks react quickly to brief clustering, while larger windows like 1,000 ticks smooth out transient spikes.
Choose your target contract structure based on your strategy goals:
Input your initial stake size along with strict session boundaries. Setting your stop loss to roughly 20% of your current session bankroll keeps a bad run from crippling your account balance.
Click the start control to initiate the automated execution cycle. The engine monitors incoming tick data and submits contract purchases according to your active logic settings.
Watch how the software processes sequential ticks. Check whether trades execute instantly when parameters match or if network latency adds delay. Running a minimum of 30 test trades on your virtual account confirms that your strategy logic matches your actual expectations.
Review the transaction log output at the bottom of the dashboard. Look at purchase entry times, contract outcome logs, and payout calculations. Verify that trade execution matches your configured profit target and stop loss triggers accurately.
Once you verify that your automation logic functions reliably on virtual capital, you can fund your real Deriv account using M-Pesa. Local mobile money deposits clear quickly, allowing you to switch the software token to your real account when you feel ready.
To test a DIGITOVER or DIGITUNDER configuration properly, you need to understand how digit percentages display on your screen during a live run. Below is an actual statistical snapshot taken over a sample of 500 consecutive ticks on the Volatility 75 Index using binary bots.
| Last Digit | Absolute Frequency | Percentage Share | Relative Status |
|---|---|---|---|
| 0 | 48 | 9.6% | Average |
| 1 | 52 | 10.4% | Average |
| 2 | 34 | 6.8% | Cold |
| 3 | 51 | 10.2% | Average |
| 4 | 49 | 9.8% | Average |
| 5 | 53 | 10.6% | Average |
| 6 | 47 | 9.4% | Average |
| 7 | 68 | 13.6% | Hot |
| 8 | 52 | 10.4% | Average |
| 9 | 46 | 9.2% | Average |
| Total | 500 | 100.0% | Complete Sample |
In this sample window, digit 7 ran unusually high at 13.6%, while digit 2 appeared only 6.8% of the time. Standard probability dictates that each digit has a theoretical 10.0% chance of occurring on any given tick.
If you were running a DIGITOVER 2 strategy during this period, your mathematical win condition required any digit from 3 through 9. Looking at the recorded distribution, digits 3 through 9 accounted for 368 out of the 500 ticks. That equals a historical success frequency of 73.6% over that specific sample window.
Conversely, if you selected DIGITUNDER 7, your contract required digits 0 through 6 to win. Those digits accounted for 334 out of 500 ticks, translating to a 66.8% win frequency in that exact frame.
Here is the essential rule every user must remember: Deriv synthetic index ticks are completely independent events.
A statistical frequency chart describes what happened in the past; it never dictates what will happen on the very next tick. Just because digit 2 ran cold over 500 ticks does not mean digit 2 is "due" to hit on the next tick. The random number generator behind synthetic indices treats every single tick as a fresh event with an exact 10% theoretical probability for every digit from 0 through 9.
Traders using binary bots kenya rely on frequency charts to measure variance away from statistical means, not to predict guaranteed future outcomes. Using historical distribution data helps you avoid entering barrier strategies during extreme clustering events, but it cannot alter individual contract odds.
When automated scripts stop placing trades or freeze on your screen, systematic checks resolve the issue quickly.
[ Active Stream Diagnostics ]
├── API Token Status: OK (Authorized)
├── WebSocket Feed: Connected (Latency: 42ms)
├── Last Tick Received: V75 - 8492.31 (0.8s ago)
└── Execution Engine: IDLE (Waiting for Trigger)
First, look at the visual connection indicator on your dashboard. If the indicator turns yellow or red, your browser lost its active socket connection to the server. Network drops on local internet connections often cause this. Reconnect your network, then refresh the dashboard page to establish a clean API session.
Second, check your token permissions if your trade log outputs an explicit authorization error message. If you generated a token without ticking the "Trade" scope box inside your Deriv account settings, the system can read incoming price streams but cannot execute contracts. Generate a new API token with both Read and Trade privileges enabled, paste it into the field, and restart the session.
Third, confirm your stake inputs match Deriv's minimum order limits. Submitting a trade below the minimum stake threshold results in immediate API rejection. Setting clear stake bounds inside the parameters panel prevents order submission errors.
To examine alternative automated strategies, you can explore the free bot library for pre-built tools designed for synthetic trading.
Try it yourself on the free bot library using a demo balance first. If you don't have one yet, create a free Deriv account.
Trading involves risk. Past performance does not guarantee future results.
Related: Binary Bots India: Run Free Digit Analysis on BinaryBot
Related: Deriv Bots Kenya: Automate Digit Strategies Instantly
Related: Configuring Digit Differ Strategy Using deriv bots india
Related: Beginner's Guide to Deriv Bots South Africa No Download
Country-specific guidance for Deriv traders — local payment rails, regulator context and the bots that suit each market.
See Bots for Your Country →You can use free browser-based analysers on BinaryBot.live to inspect real-time tick statistics and evaluate market performance on a virtual balance. This lets you test strategies like DIGITOVER and DIGITUNDER without exposing your capital to live market conditions.
No, you don't need to install any software or configure browser extensions. The portal connects directly to Deriv over their official API using the access credentials you supply.
You enter your personal API token, which is generated inside your Deriv account settings, into the API Connection Panel. This authenticates your session and lets the system know whether to execute contracts on your Virtual or Real Account.
You can commit KES through M-Pesa after testing your strategies on a virtual balance using browser-based tools. This allows you to verify contract timing and barrier positioning before moving to live money transactions.
Guides closest to this one.
Learn how beginners use Deriv Bots South Africa with browser tools and ZAR accounts. Start trading digits with zero downloads. Read the guide today.
Learn how binary bots india users can connect to Deriv, run free digit analysis, and execute trades without installation on BinaryBot.live today.
Discover deriv bots kenya automation for DIGITODD and DIGITEVEN strategies using M-Pesa funded Deriv accounts on BinaryBot.live. Start trading today.