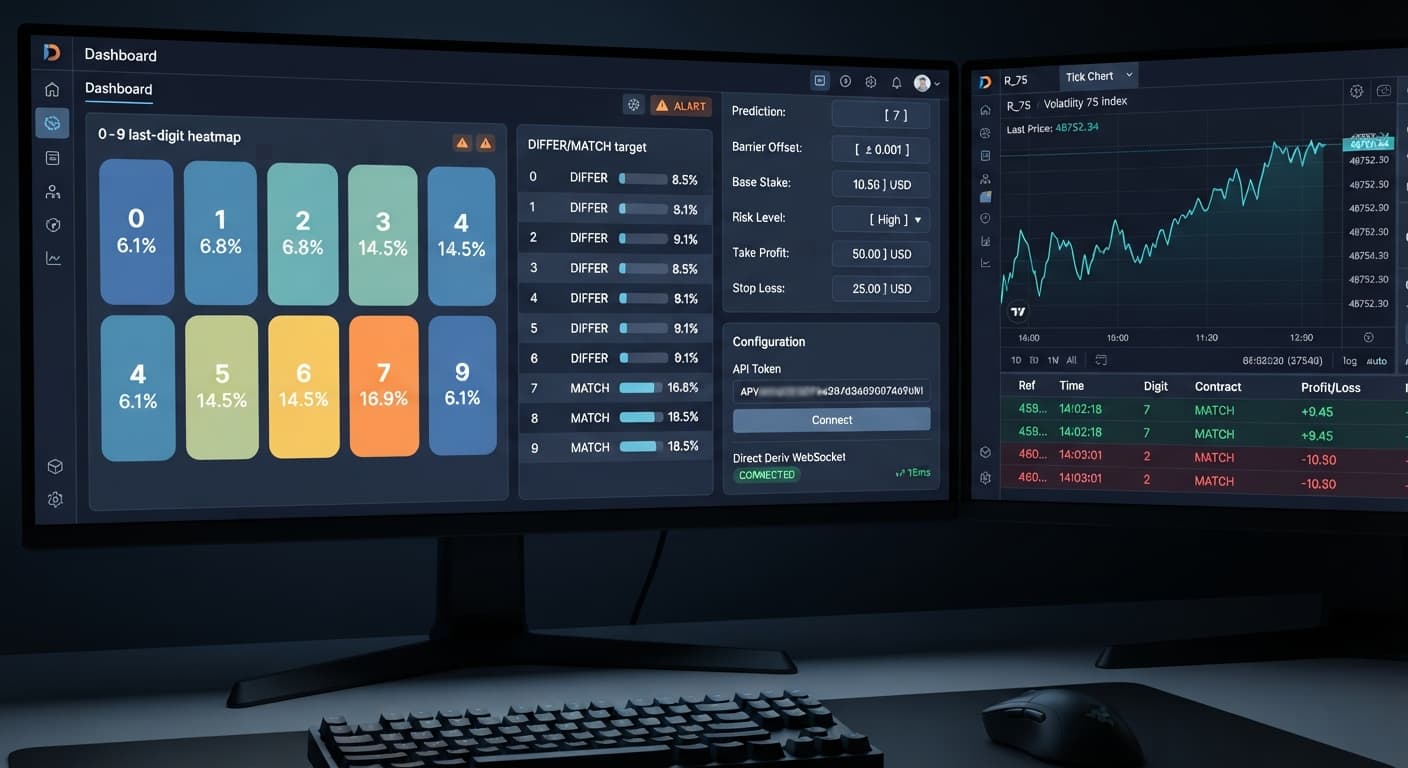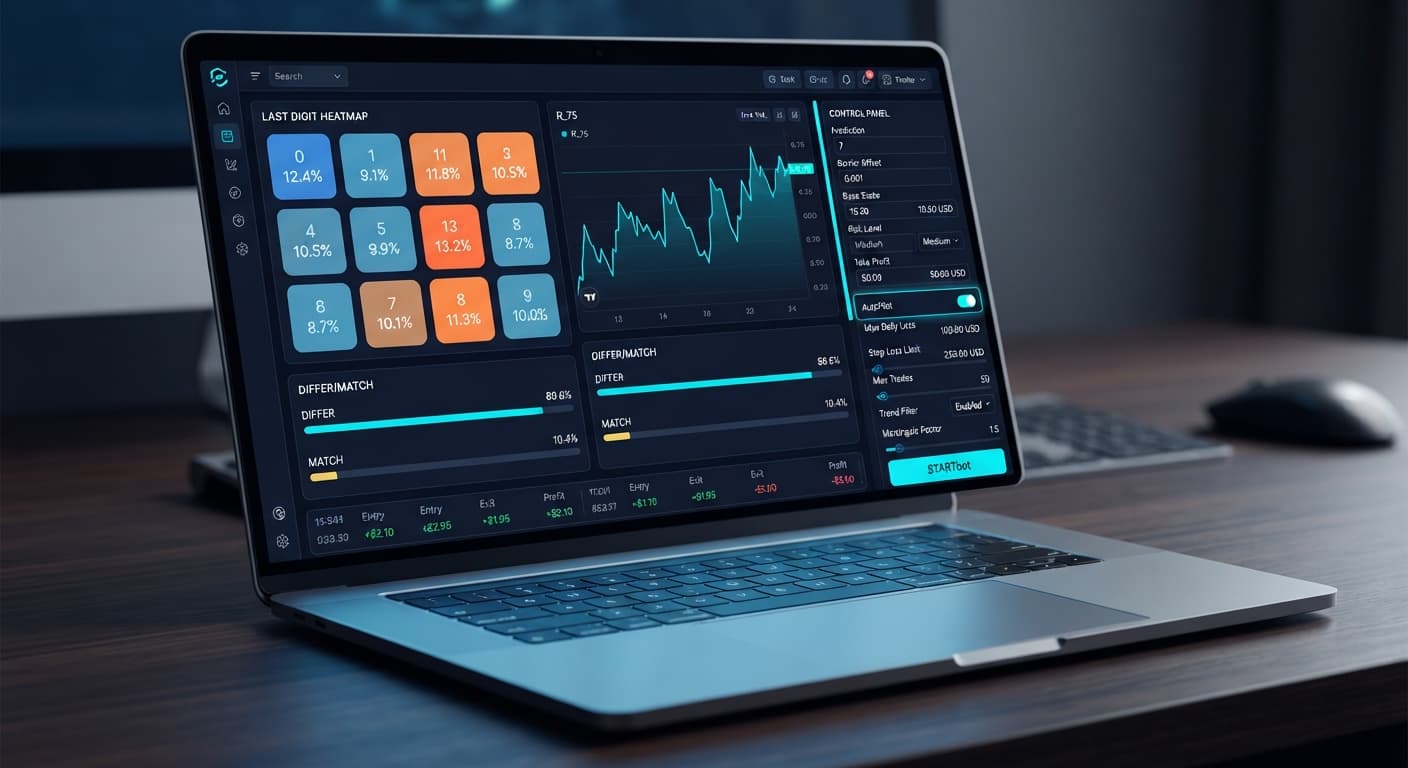
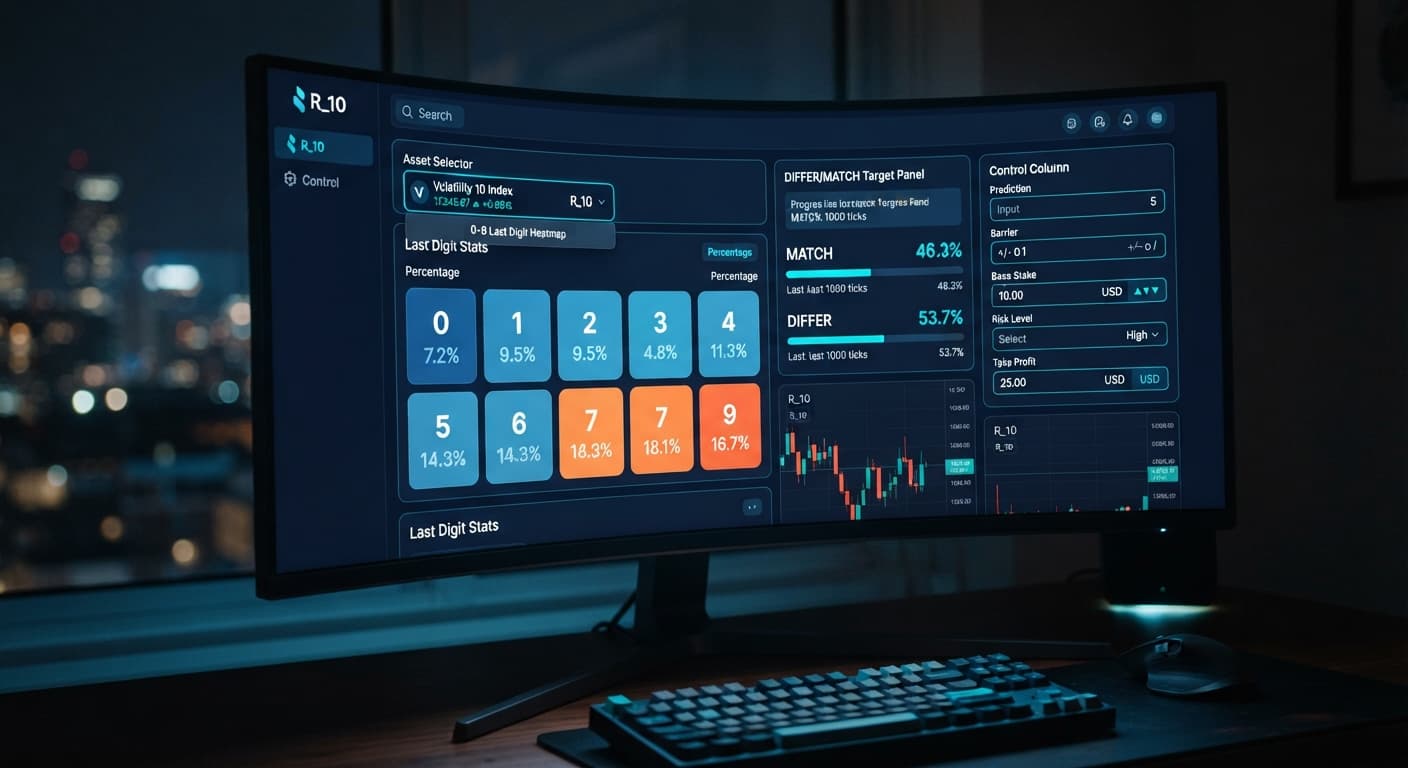
Digit Analysis
How to Run LDP Analyzer Pro on Volatility 10
Follow 3 simple steps to run ldp analyzer pro on volatility 10 by linking your Deriv token, setting predictions, and configuring risk controls.
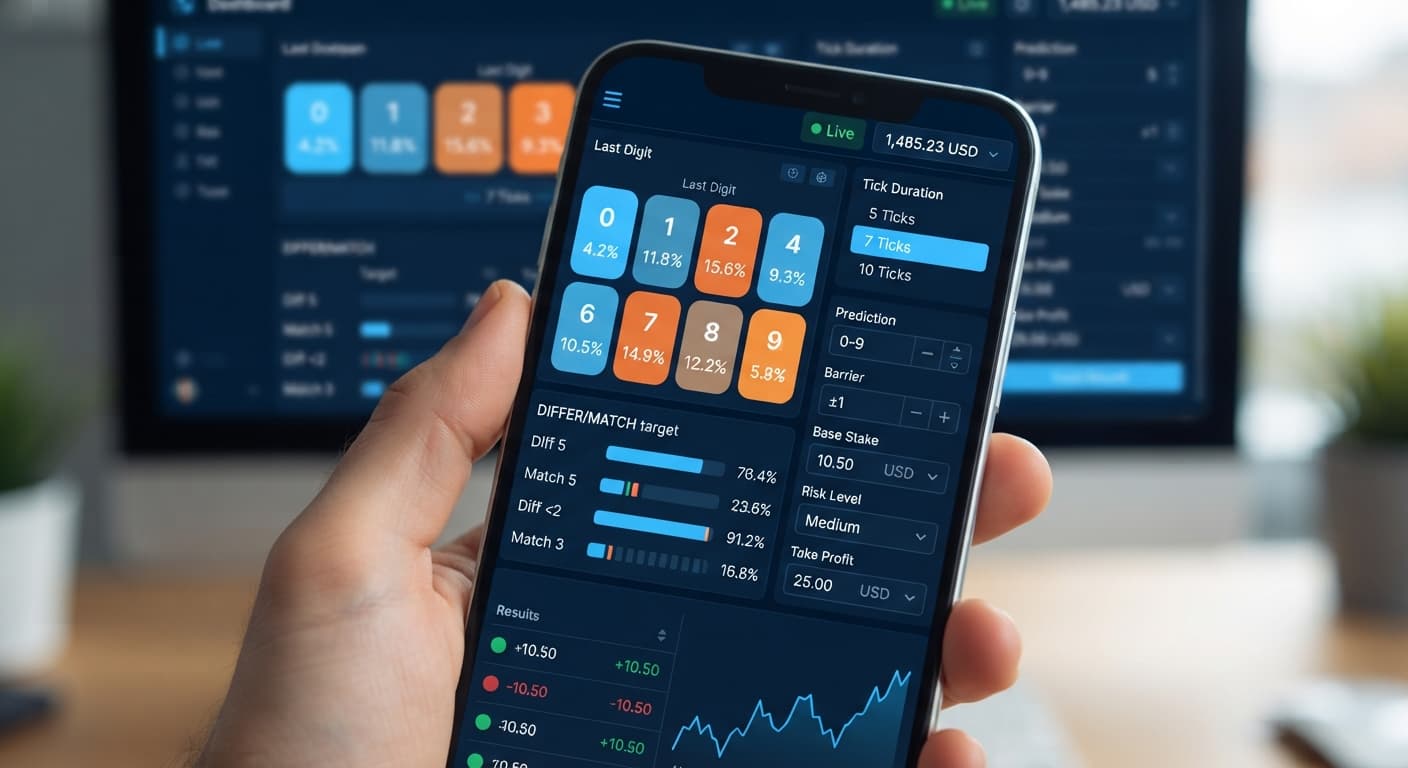
Determining the ldp analyzer pro best time to trade Deriv volatilities comes down to identifying statistical digit imbalances on the live heatmap rather than watching a clock. Because Deriv synthetic indices run on continuous random number generators 24 hours a day, traditional market session openings like London or New York don't change tick liquidity. Instead, the ldp analyzer pro best time to trade happens dynamically when a single digit's occurrence rate drops below 5% or spikes above 15% over a 50-tick or 100-tick window, offering a clear statistical extreme to target.
To trade these setups effectively, you need to understand how the underlying contracts function, how tick durations affect sample sizes, and how automated execution handles order entries.
Deriv synthetic indices—such as Volatility 10, Volatility 75, or Vol 100 (1s)—generate ticks where the final digit is a single number from 0 to 9. Over millions of ticks, every digit has an equal 10% theoretical probability of appearing. In short sequences of 10 to 100 ticks, however, random distribution creates temporary clusters and cold spots.
When using an LDP analyzer for last digit prediction, you monitor these temporary shifts in real time. For example, if digit 7 hasn't appeared once in the last 30 ticks, its sample percentage drops near 0%. If you place a DIGITDIFF contract (predicting the next tick will not end in 7), you are betting against a specific digit. Alternatively, if you trade a DIGITEVEN contract while even digits account for 70% of the last 50 ticks, you are targeting a active distribution bias.
It's vital to remember that past ticks don't alter the probability of the next draw. Synthetic ticks are completely independent random events. The heatmap doesn't predict the future; it shows you current distribution state so you can align your trade settings with real statistical filters instead of guessing.
Many automated strategies fail because traders underestimate how fast stake multipliers compound after a loss. When running automated digit strategies on binary bots, martingale recovery systems double your required balance in seconds.
Let's look at a concrete run using a DIGITEVEN strategy on the Volatility 75 Index. You start with a $100 balance, set your Base Stake to $2, and set your Risk Level to Moderate (2x multiplier).
| Trade # | Contract Type | Stake | Trade Result | Loss / Win Total | Running Balance |
|---|---|---|---|---|---|
| 1 | DIGITEVEN | $2.00 | Loss | -$2.00 | $98.00 |
| 2 | DIGITEVEN | $4.00 | Loss | -$4.00 | $94.00 |
| 3 | DIGITEVEN | $8.00 | Loss | -$8.00 | $86.00 |
| 4 | DIGITEVEN | $16.00 | Loss | -$16.00 | $70.00 |
| 5 | DIGITEVEN | $32.00 | Loss | -$32.00 | $38.00 |
| 6 | DIGITEVEN | $64.00 | Insufficient Funds | N/A | $38.00 (Stopped) |
Look at trade six. After five straight losses, your total drawdown sits at $62. To place the sixth trade and attempt to recover your losses, the system demands a $64 stake. Your remaining balance is $38. Your account is locked out of the next trade, leaving you with a 62% account loss in under two minutes.
This is why understanding multiplier maths matters more than picking winning digits. On an aggressive 2.5x multiplier, that same five-trade loss sequence burns through $156.25, blowing past a $100 bankroll even faster.
Setting up your session correctly on LDP Analyzer Pro keeps execution clean and limits human error when signals trigger.
Step 1: Open LDP Analyzer Pro in your browser and enter your Deriv API token to link your account.
Step 2: Choose your market from the dropdown menu. Select Volatility 75 or Vol 75 (1s) for steady tick generation.
Step 3: Pick your strategy mode. Select Over/Under if you want to trade barrier splits, or Match/Differ for digit target strategies.
Step 4: Configure your duration and entry rules using the exact control inputs on the dashboard:
Step 5: Define your financial boundaries before launching trading:
Step 6: Click AutoPilot if you want server-side execution. This ensures the bot executes trades instantly when AI signal confidence clears your chosen threshold, even if your browser connection hiccups.
Using automated deriv bots this way removes emotional hesitation when entering trades during quick statistical shifts.
Knowing when not to trade is as critical as knowing the ldp analyzer pro best time to trade. Digit analysis tools rely on live statistical samples, but those samples can easily trick you due to the Gambler's Fallacy.
If digit 3 hasn't appeared for 40 ticks, traders often assume it's "due" to hit and start firing DIGITMATCH contracts on 3, or open DIGITUNDER contracts with a high Barrier. This is dangerous. Because every tick draw on Deriv is independent, the probability of digit 3 appearing on tick 41 remains exactly 10%. A cold digit can easily stay cold for 80 or 100 ticks straight.
Furthermore, rapid price movements in indices like Volatility 100 or Vol 100 (1s) don't mean digits distribute more evenly. High volatility changes the price scale, not the randomness of the final digit. If you run a strategy during long digit droughts without a hard loss limit, your martingale sequence will run out of capital long before the statistical anomaly corrects itself.
To survive long enough for statistical strategies to work, you must enforce strict capital risk boundaries. Never run a bot without explicit risk parameters configured on the tool's interface.
If you want to review other automated strategies or test different digit analysis configurations across our suite of deriv bots, check out the free bot library for additional web tools.
Start testing settings safely today on LDP Analyzer Pro using a demo balance.
If you don't have a trading setup ready yet, create a free Deriv account to get started.
Trading involves risk. Past performance does not guarantee future results.
Related: Is LDP Analyzer Pro Safe? Digit Analysis & Matches/Differs Risk
Related: LDP Analyzer Pro Deriv Bots Guide: Set Up AutoPilot
A fast Deriv digit-analysis tool and trading bot with a live 0-9 last-digit heatmap, DIFFER/MATCH targets, even-odd and over-under signals, and a 3-strategy auto-trader with risk controls.
Open LDP Analyzer Pro →The best time happens dynamically when a single digit's occurrence rate drops below 5% or spikes above 15% over a 50-tick or 100-tick window. You shouldn't watch a clock for traditional market sessions because Deriv synthetic indices run 24 hours a day on continuous random number generators.
LDP Analyzer Pro monitors temporary shifts in real time by showing you the current distribution state of synthetic ticks through a live heatmap. This lets you align your trade settings with real statistical filters instead of guessing, though past ticks don't alter the probability of the next independent random draw.
A martingale recovery system can wipe out your account in seconds because stake multipliers rapidly compound after a loss. For example, using a moderate 2x multiplier with a $100 starting balance and a $2 base stake can drain 62% of your funds within five straight losses.
Automated strategies often fail because traders underestimate how quickly stake multipliers demand higher balances. If your running balance drops too low during consecutive losses, you won't have enough funds to place the next required trade and your account will be locked out.
Guides closest to this one.
Follow 3 simple steps to run ldp analyzer pro on volatility 10 by linking your Deriv token, setting predictions, and configuring risk controls.
Is LDP Analyzer Pro safe? Technically yes via API security, but financial risk remains high if you run unchecked stake recovery setups.
Follow this ldp analyzer pro deriv bots guide to configure AutoPilot and risk controls for precise digit analysis on Deriv. Start trading smarter today.