Digit Analysis
Is LDP Analyzer Safe for Volatility Indices Trading?
Find out if ldp analyzer safe for trading Deriv synthetic indices by examining technical security, API tokens, tick latency, and random number generators.
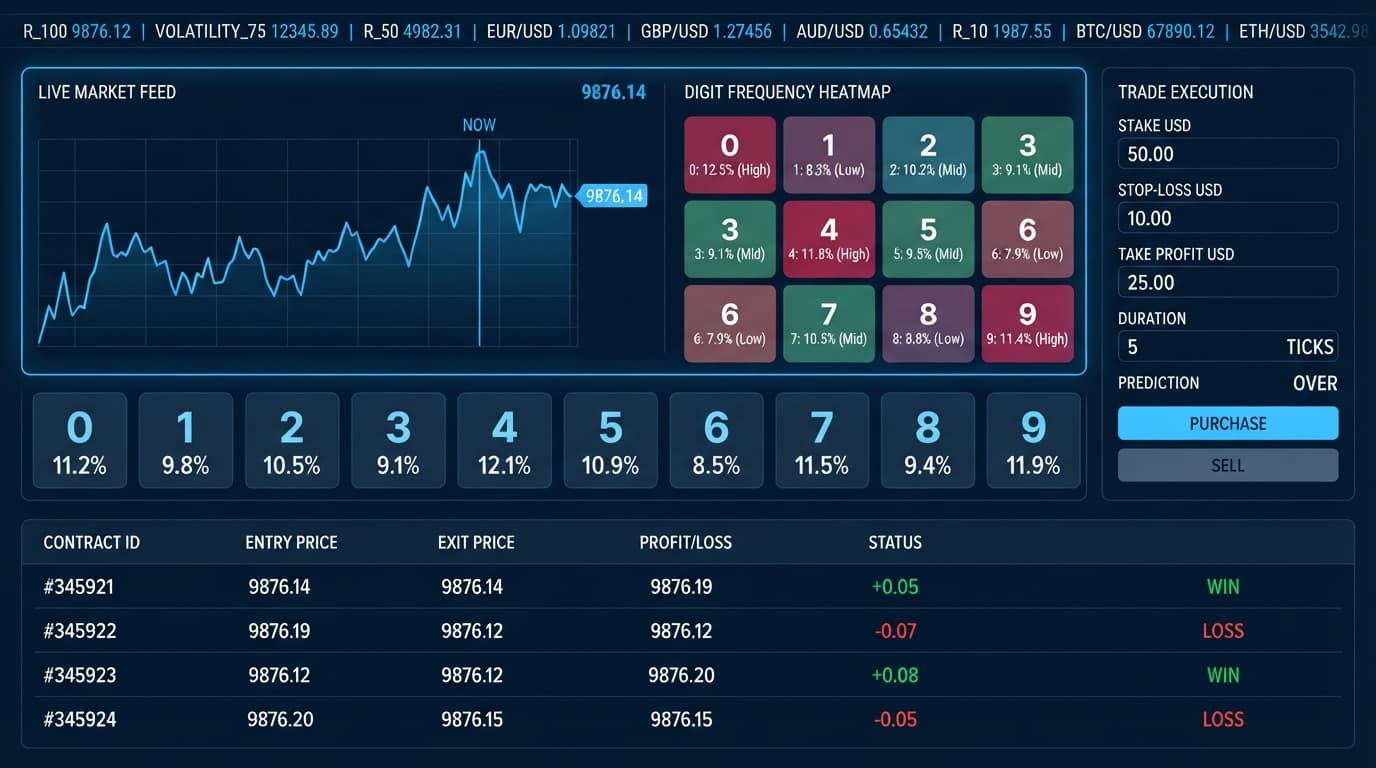
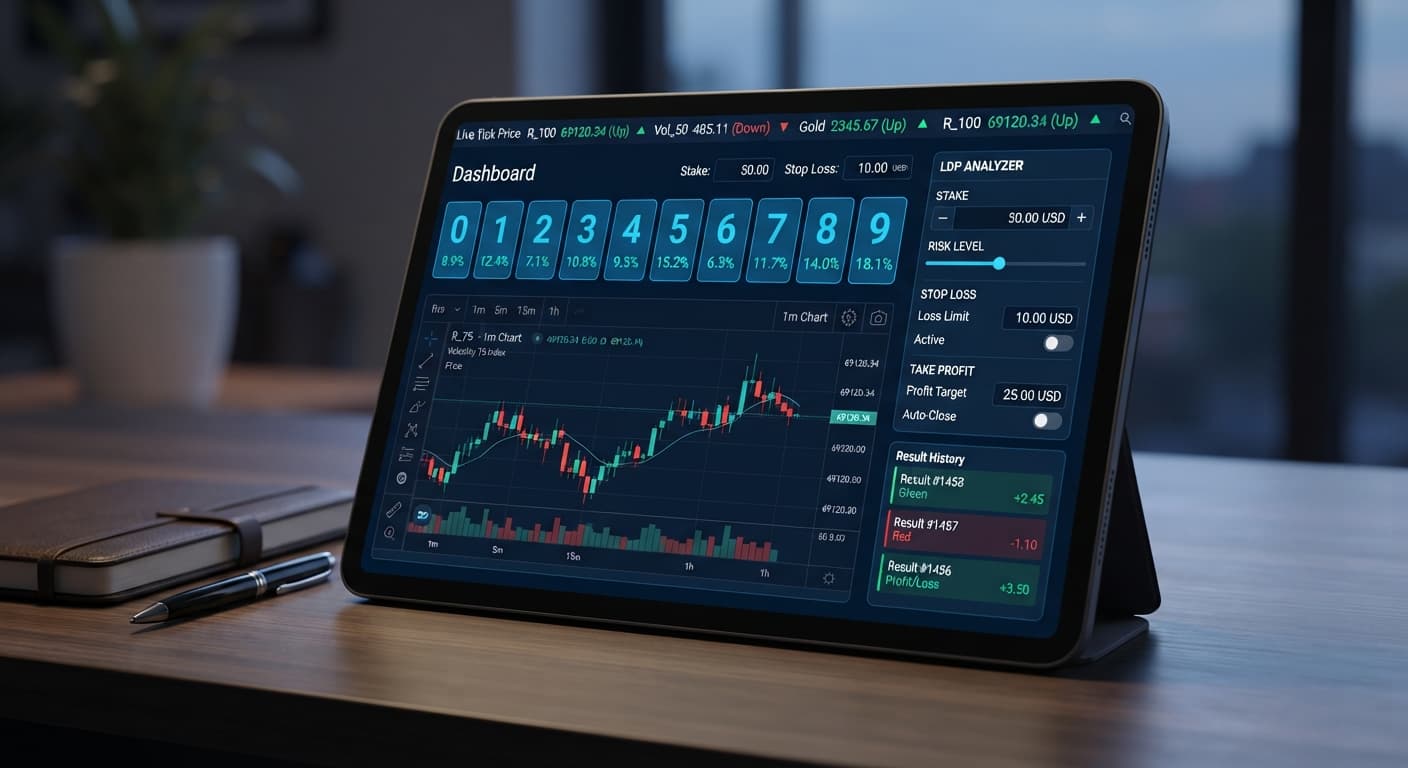
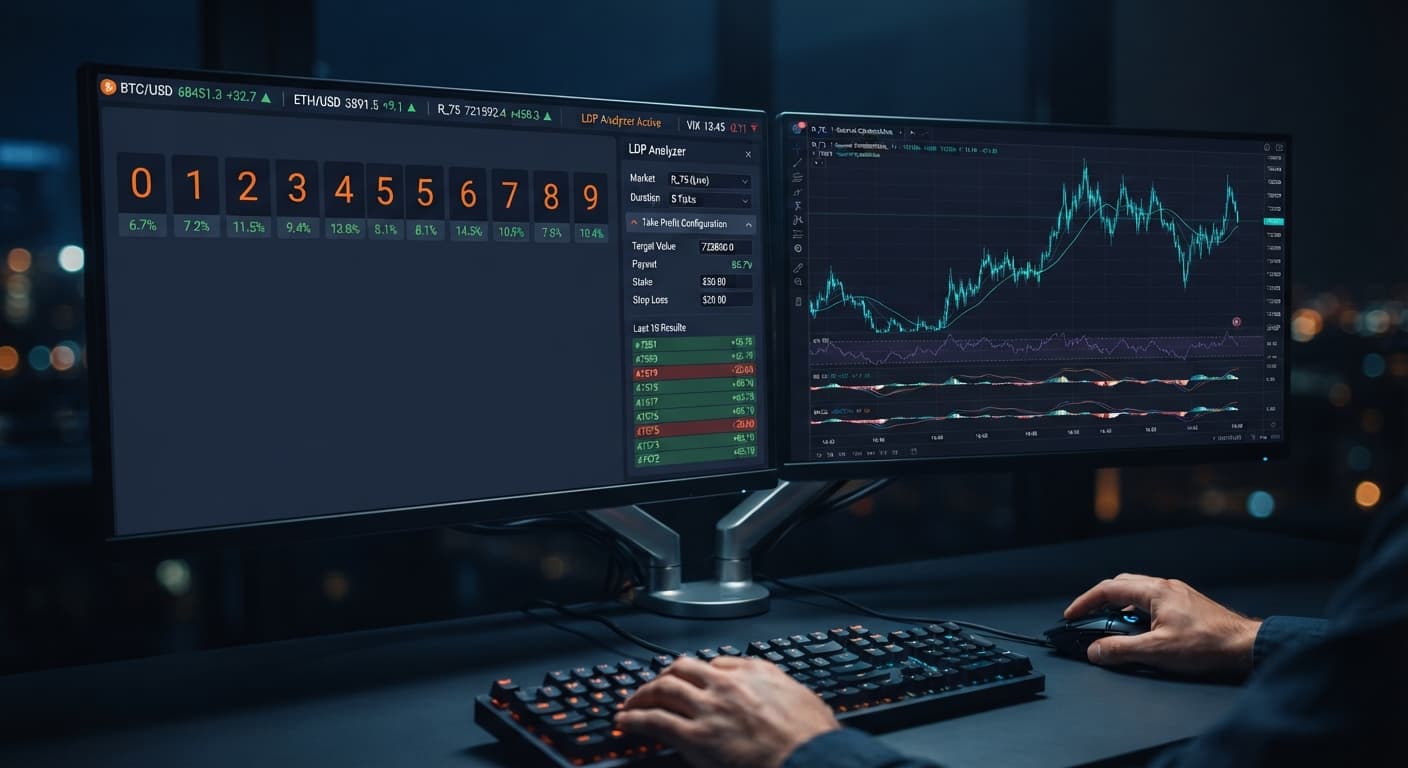
Running the LDP Analyzer on Volatility 25 gives you direct line-of-sight into the tick-by-tick stream of one of Deriv's most popular synthetic indices. To get started with the ldp analyzer on volatility 25, you paste your Deriv API token into the Deriv API token connection field, pick Volatility 25 from the market selector, set your stake along with your stop loss and take profit limits, and choose whether to run real-time digit analysis or launch automated strategy execution. The browser app hooks directly into Deriv's stream so you can monitor digit bias as it happens.
This guide is built for traders who want to skip manual tick-counting and inspect price action as raw last-digit statistics. Whether you're running demo trades to test a pattern hypothesis or using automated tools to place digit contracts, following these five steps ensures your connection is solid and your risk controls are active before a single trade hits the order book.
Before you touch any controls on the web app, make sure you have these prerequisites ready:
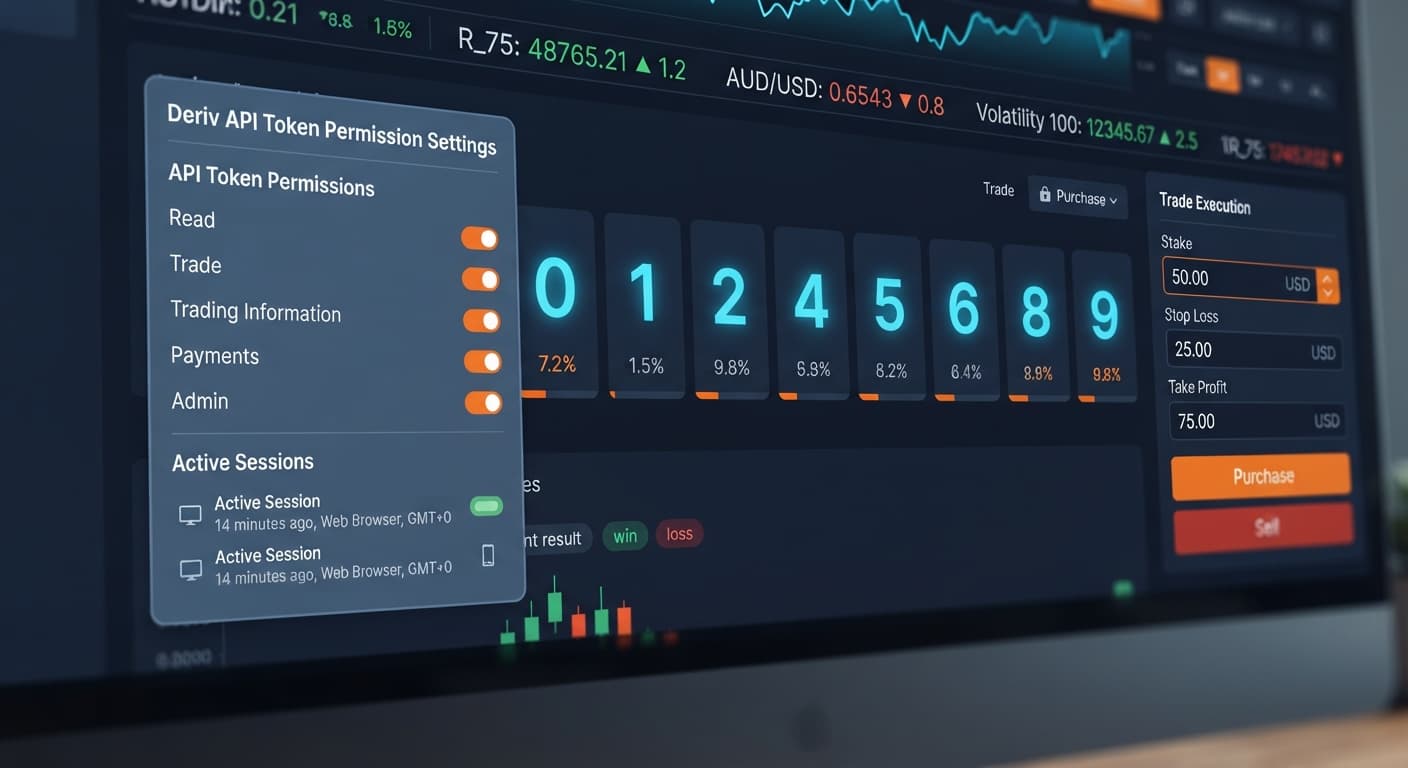
Log into your Deriv account, navigate to your security settings, and open the API Token tab. Type a recognizable label like "LDP-Analyzer" into the token name field.
Select the Read checkbox so the web app can read live tick prices, and select the Trade checkbox so it can execute digit contracts on your behalf. Click Create, then copy the generated alphanumeric string to your clipboard. Keep this token private—it acts as your account password for third-party tools.
Open the web app in your browser and locate the input box labeled Deriv API token connection. Paste your copied API token into the text field and click the connection toggle.
+-------------------------------------------------------+
| Deriv API token connection                            |
| [ ************************************ ]  [ CONNECT ] |
+-------------------------------------------------------+
| Status: Connected (Demo Account - USD)                |
+-------------------------------------------------------+
Within a second, the connection status light will turn green. The screen displays your active account balance and account ID. If you see an authentication error, your token was likely created without the required Read or Trade permissions, or a character was trimmed during copy-pasting.
Click the dropdown menu labeled market selector. Scroll through the list of synthetic assets and select Volatility 25.
As soon as you pick the market, the incoming price stream activates. The last digit of every tick on Volatility 25 updates in real time on your display. If you trade 1-second index variants, you can also pick Volatility 25 (1s) from the same dropdown menu depending on your preferred tick speed.
Before activating automated trades, enter your exact capital management parameters into the input fields on screen.
+------------------+------------------+------------------+
| Stake            | Stop Loss        | Take Profit      |
| [ $1.00        ] | [ $10.00       ] | [ $5.00        ] |
+------------------+------------------+------------------+
Entering these figures before starting your trading session ensures your running script halts automatically if your session target or loss limit is breached.
Choose how you want to interact with the Volatility 25 stream using the primary mode toggles:
Toggle to automated strategy execution if you are ready to trade, or remain on real-time digit analysis to paper-trade your observations first.
| Control Name | Setup Value (Example) | Function on Screen |
|---|---|---|
| Deriv API token connection | p3K9...xQ2 |
Authenticates account and streams live account balance |
| market selector | Volatility 25 |
Channels live tick feed from Volatility 25 index |
| stake | $1.00 |
Sets dollar value purchased per contract |
| stop loss | $10.00 |
Automatically stops trade execution when drawdown hits target |
| take profit | $5.00 |
Automatically stops trade execution when gain target is reached |
When running the ldp analyzer on volatility 25, the software aggregates every tick to build a historical snapshot of recent output. Below is a realistic 500-tick sample distribution recorded on Volatility 25.
| Last Digit | Absolute Count (out of 500 Ticks) | Observed Frequency (%) | Status |
|---|---|---|---|
| 0 | 42 | 8.4% | Cold |
| 1 | 56 | 11.2% | Average |
| 2 | 38 | 7.6% | Cold |
| 3 | 64 | 12.8% | Hot |
| 4 | 51 | 10.2% | Average |
| 5 | 48 | 9.6% | Average |
| 6 | 68 | 13.6% | Hot |
| 7 | 45 | 9.0% | Cold |
| 8 | 43 | 8.6% | Cold |
| 9 | 45 | 9.0% | Cold |
| Total | 500 | 100.0% | -- |
Looking at this distribution, digits 3 (12.8%) and 6 (13.6%) ran hotter than statistical averages over this specific sample window, while digits 0, 2, and 8 were cold.
If you are using manual observations or setting up conditional triggers on deriv bots, a temporary imbalance like this shows what has happened, not what will happen. Deriv synthetic index ticks are independent random draws. A digit showing a low frequency over 500 ticks carries the exact same mathematical probability (10%) on the very next tick as any other digit. Frequency stats show current sample variance; they do not bend future probabilities.
If your strategy targets high-probability contracts like DIGITUNDER 7 or DIGITEVEN, seeing a temporary spike in middle digits helps you evaluate whether current market conditions match your trading plan rules. For advanced heatmaps, MATCH/DIFFER target zones, and automated execution scripts, traders often upgrade from the base tool to LDP Analyzer Pro.
Automated workflows on synthetic markets move fast. When running binary bots or custom analysis scripts, understanding where setups break down helps you protect your bankroll.
+-------------------------------------------------------------------+
| SITUATION: Internet Latency Drop / API Disconnect                  |
| ACTION: Bot halts order stream, API token re-authenticates        |
+-------------------------------------------------------------------+
| SITUATION: Unexpected Losing Sequence                             |
| ACTION: Hard Stop Loss triggers -> Bot shuts down session        |
+-------------------------------------------------------------------+
Testing any automated script or digit tool requires practice under real market conditions without financial risk. Always test your settings on a Deriv demo account before connecting real capital to any tool in our free bot library.
Mastering the ldp analyzer on volatility 25 allows you to systematically inspect tick behaviors, automate execution cleanly, and enforce strict capital boundaries on every trading session.
To start analyzing live tick streams right now in your browser, open the free LDP Analyzer and connect your practice feed.
If you don't have an active trading account yet, create a free Deriv account to generate your API token.
Trading involves risk. Past performance does not guarantee future results.
Related: Is LDP Analyzer Safe for Volatility Indices Trading?
Related: LDP Analyzer Small Account Strategy: Stake & Stop Loss Setup
Free LDP Binary Analyzer — AI-powered last-digit analysis for Deriv traders with real-time binary analysis and automated strategies.
Open LDP Analyzer →You connect by generating an API token in your Deriv account settings and pasting it into the Deriv API token connection field on the app. Make sure you tick both the Read and Trade scope boxes when creating the token so the app can read live ticks and execute trades.
Your API token needs both Read and Trade scopes enabled. The Read permission lets the LDP Analyzer stream live tick prices, while the Trade permission allows it to execute digit contracts.
You click the market selector dropdown menu, scroll through the synthetic assets list, and pick Volatility 25. Once selected, the incoming price stream activates and updates the last digit of every tick in real time.
You're strongly recommended to use a virtual demo account while testing your settings and session plan. This lets you inspect price action and test pattern hypotheses without risking real funds.
Guides closest to this one.
Find out if ldp analyzer safe for trading Deriv synthetic indices by examining technical security, API tokens, tick latency, and random number generators.
Set your stake to $0.35, stop loss to $3.00, and take profit to $2.00 with this ldp analyzer small account strategy for a $20 Deriv account balance.
Set your ldp analyzer take profit settings to 2% to 5% of your total account balance or 2 to 4 times your stake to lock in automated gains.