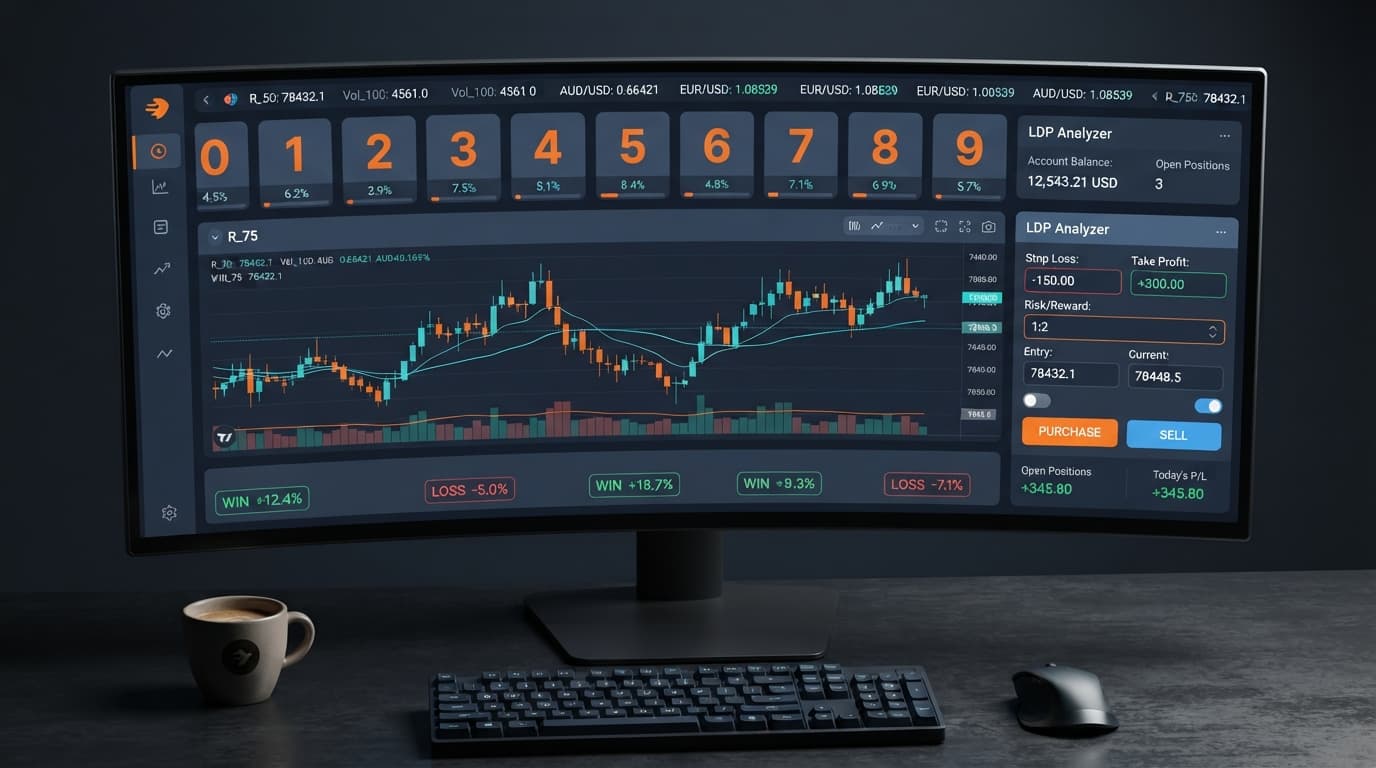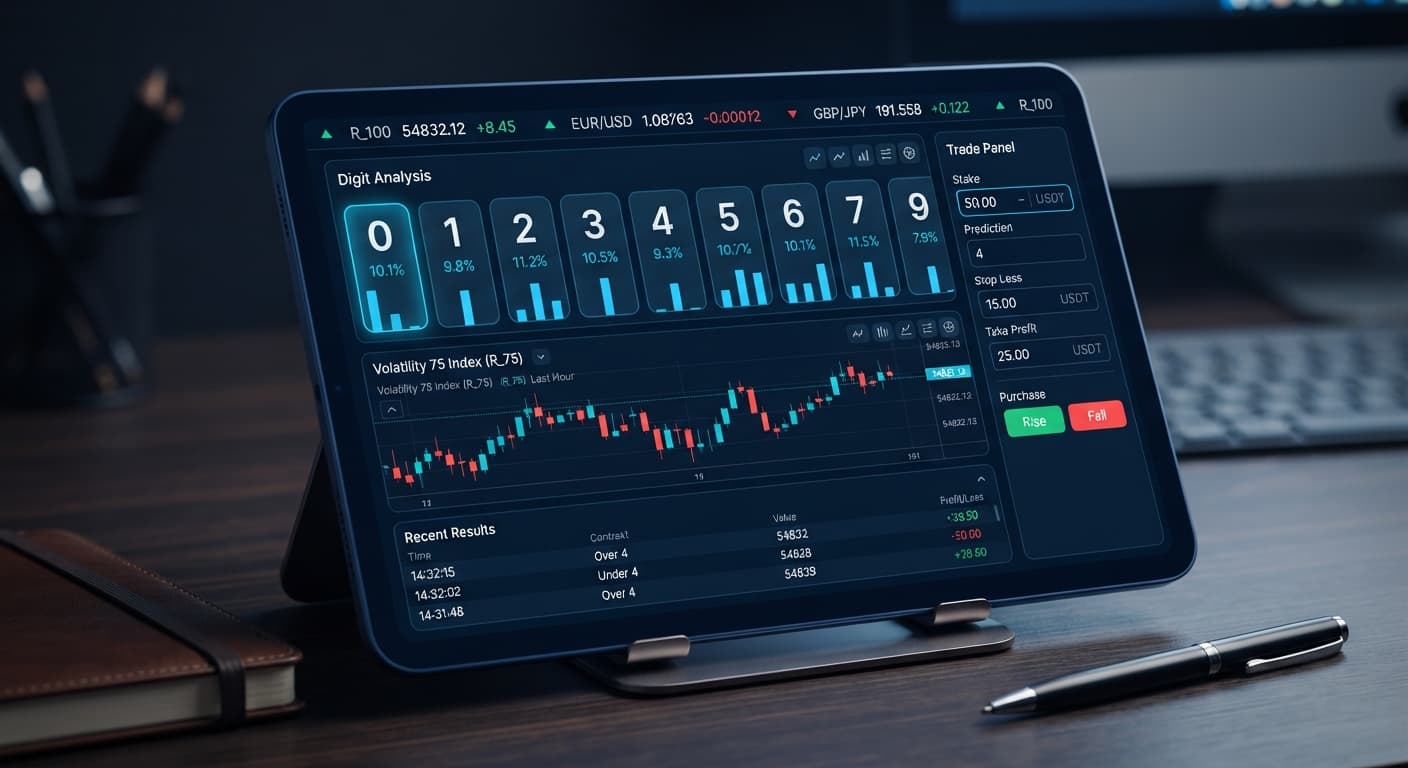
Digit Analysis
LDP Analyzer API Token Setup: Connect & Automate Deriv Bots
Master ldp analyzer api token setup to connect Deriv bots for real-time digit analysis and automated binary strategy execution. Start trading today.
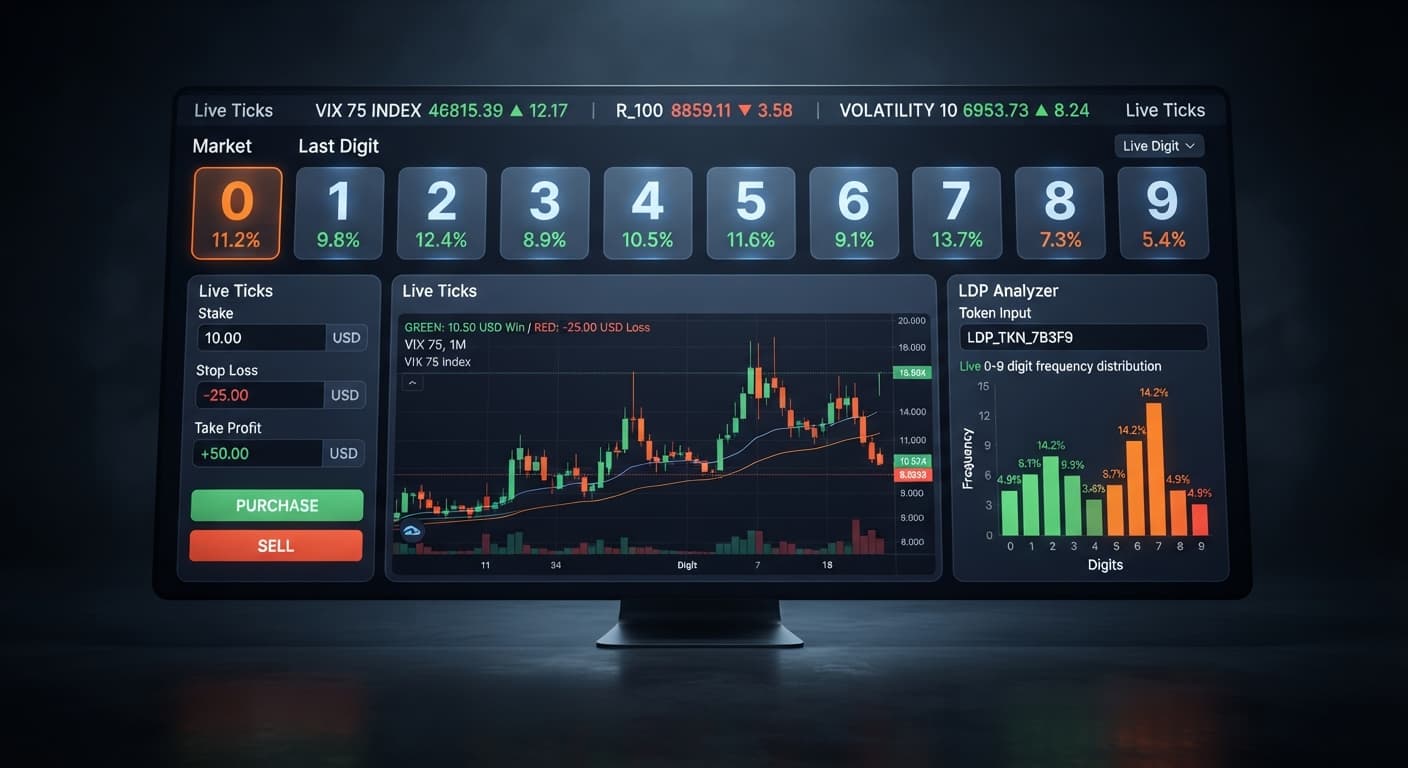
This ldp analyzer deriv bots guide shows you how to connect your Deriv API token, configure real-time digit analysis, and launch automated contract execution directly in your web browser. You set your stake, stop loss, and take profit, select your target market, and execute digit contracts like DIGITEVEN or DIGITUNDER automatically. No software downloads are required, and your funds remain safely inside your account at all times.
If you want to trade synthetic index digits without manually clicking every single tick, this walkthrough is for you. By the time you finish reading, you'll have a live automated workflow running on your demo balance, reading tick data and executing trades according to your exact settings.
Before you start configuring the interface, gather these basics:
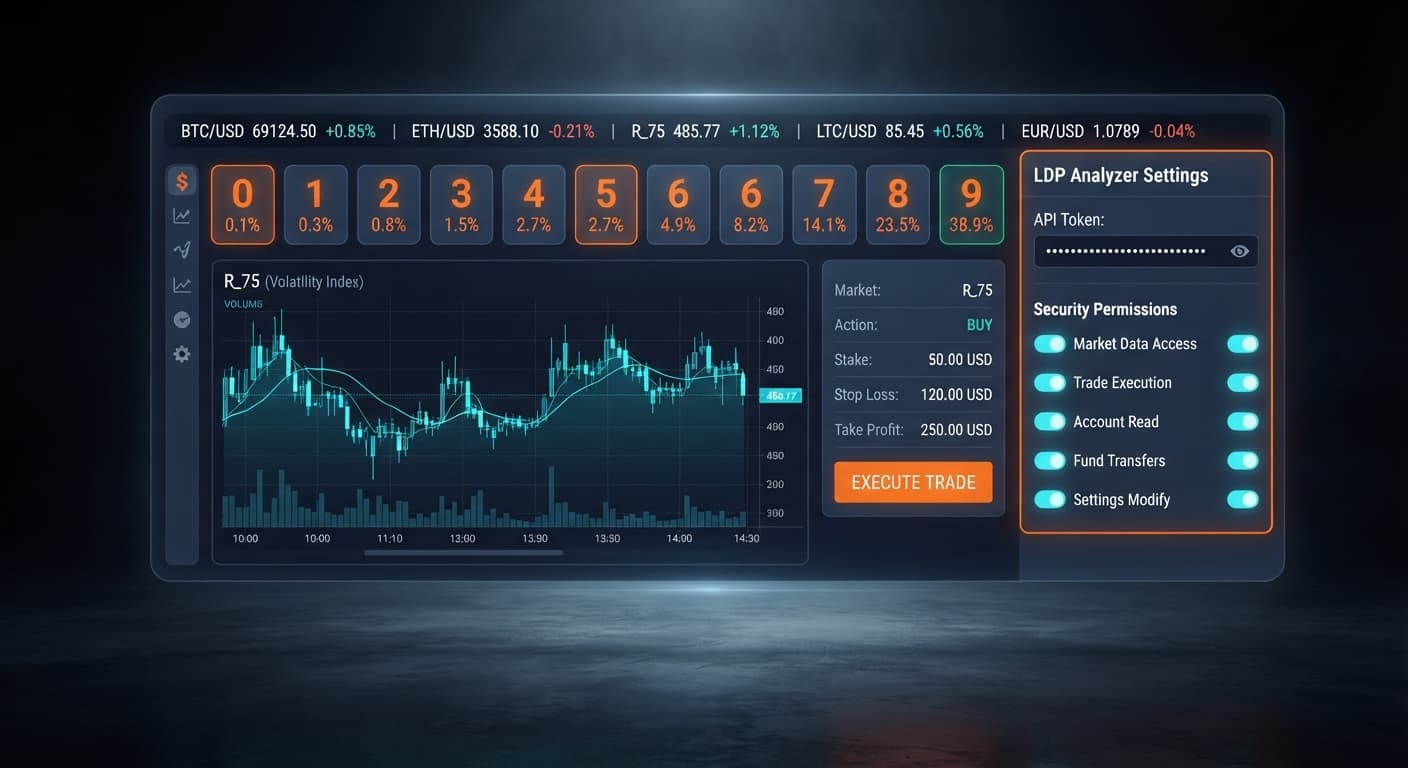
Open the free LDP Analyzer web app in your browser. Look for the input field labeled Deriv API token connection.
Head over to your Deriv account security settings, navigate to the API Token section, and create a new token. Check the boxes for Read and Trade. Copy that alphanumeric string, return to the analyser interface, and paste it directly into the Deriv API token connection field. Once you hit connect, the interface establishes an immediate socket session directly to Deriv. The status indicator on your screen will switch from disconnected to connected, displaying your account balance in real time.
Locate the market selector drop-down menu on the interface control panel. This menu populates all supported synthetic indices available for digit extraction.
Select your preferred volatility market. Your choices include standard options like Volatility 10, Volatility 25, Volatility 50, Volatility 75, and Volatility 100, alongside their respective 1s variants (such as Volatility 10 (1s) or Volatility 75 (1s)). As soon as you make a choice, the analyzer immediately starts capturing incoming tick streams for that market. The real-time digit stream display on your screen will immediately update with every new tick price published by the server.
Before enabling automated trading features, you must fill out the core risk values on the control panel:
1.00).10.00).5.00).Entering these parameters creates hard guardrails for your running session. When the tool executes contracts on your account, it tracks net session P&L. If your net loss reaches $10.00 or your net profit reaches $5.00, the automated engine stops firing instantly.
Next, select your execution preference between real-time digit analysis and automated strategy execution.
If you select real-time digit analysis, the tool monitors incoming ticks and displays digit counts, but leaves trade triggers in your hands. If you switch to automated strategy execution, the engine evaluates incoming numbers and places trades automatically based on your active rule. Pick your target contract type from the supported selection: DIGITEVEN, DIGITODD, DIGITOVER, DIGITUNDER, DIGITMATCH, or DIGITDIFF. For instance, selecting DIGITUNDER with a prediction barrier of 7 means you win whenever the final price digit lands on 0 through 6.
Review your input fields carefully to confirm that your stake, stop loss, and take profit values are set correctly. Click the Start button on the dashboard to engage the automated engine.
The live log on your screen immediately begins logging every evaluated tick alongside outgoing trade confirmations. When a trade fires, you'll see the contract ID, purchase price, entry digit, exit digit, and net P&L update on screen in real time. If you need to pause trading at any point, hit the Stop button to halt all automated contract requests.
Different synthetic markets generate price updates at varying frequencies. Standard volatility indices update price every two seconds, while 1s variants generate a new price tick every single second. Understanding these exact timings prevents confusion when running automated deriv bots against rapid price ticks.
Here is how clock time, tick counts, and entry points align during a typical execution window:
| Market Type | Duration Setting | Total Ticks Captured | Elapsed Clock Time | Entry Landing Point |
|---|---|---|---|---|
| Volatility 75 Index | 1 Tick | 1 tick | 2.0 Seconds | Tick 1 immediately after purchase |
| Volatility 75 Index | 5 Ticks | 5 ticks | 10.0 Seconds | Settlement on 5th consecutive tick |
| Volatility 75 (1s) Index | 1 Tick | 1 tick | 1.0 Second | Tick 1 immediately after purchase |
| Volatility 75 (1s) Index | 5 Ticks | 5 ticks | 5.0 Seconds | Settlement on 5th consecutive tick |
| Volatility 100 Index | 10 Ticks | 10 ticks | 20.0 Seconds | Settlement on 10th consecutive tick |
When running binary bots on a standard Volatility 75 Index with a 1-tick contract, your trade opens on tick zero and settles exactly 2.0 seconds later on tick one. If you switch your market selector to Volatility 75 (1s), that same 1-tick contract duration completes in 1.0 second.
Because last digits are generated randomly at every tick interval, shorter duration windows mean higher trade frequency. Running automated strategy execution on 1s markets fires trades twice as fast as standard markets. Make sure your risk parameters reflect this faster execution pace, as session drawdown or profit targets will be reached in half the clock time.
Trading digit contracts carries inherent risk. Synthetic index ticks are mathematically independent draws—past digit patterns do not alter the statistical probability of the next tick. Here are four common operational mistakes traders make, paired with the specific controls to mitigate them.
If you want to explore advanced visual heatmaps, custom DIFFER/MATCH targets, and full auto-trader modules, you can upgrade to LDP Analyzer Pro at any time. Alternatively, you can browse the free bot library to test other automated strategies across different synthetic assets.
Try the automated strategy features yourself on LDP Analyzer using a demo balance first.
If you don't have a trading account yet, create a free Deriv account to start testing.
Trading involves risk. Past performance does not guarantee future results.
Related: LDP Analyzer API Token Setup: Connect & Automate Deriv Bots
Free LDP Binary Analyzer — AI-powered last-digit analysis for Deriv traders with real-time binary analysis and automated strategies.
Open LDP Analyzer →You'll need to generate a Deriv API token with both 'Read' and 'Trade' scopes checked from your account security settings. Copy that token, paste it into the Deriv API token connection field on the LDP Analyzer web app, and hit connect to establish a direct socket session.
You must check both the 'Read' and 'Trade' scopes when creating your API token in your Deriv account. Without these permissions, the LDP Analyzer won't be able to connect or execute automated contracts on your behalf.
No software downloads are required to use the tool. It runs directly in your web browser, allowing you to connect via your API token and launch automated contract execution right online.
You simply enter your maximum acceptable session loss into the stop loss field and your profit target into the take profit field on the control panel. These values create hard guardrails that instantly stop the automated engine once your net P&L hits either threshold.
Guides closest to this one.
Master ldp analyzer api token setup to connect Deriv bots for real-time digit analysis and automated binary strategy execution. Start trading today.
Master the LDP Analyzer stop loss setup for Deriv bots. Learn how to configure risk management controls to protect your capital. Start reading today.
Discover why your ldp analyzer keeps losing on Deriv bots. Learn how to fix stake sizes, stop loss, and take profit settings. Test strategies for free today.