Digit Analysis
How to Use LDP Analyzer on Volatility 25 for Digits
Follow these 5 steps to use the ldp analyzer on volatility 25, connect your Deriv API token, and set your stake, stop loss, and take profit limits.
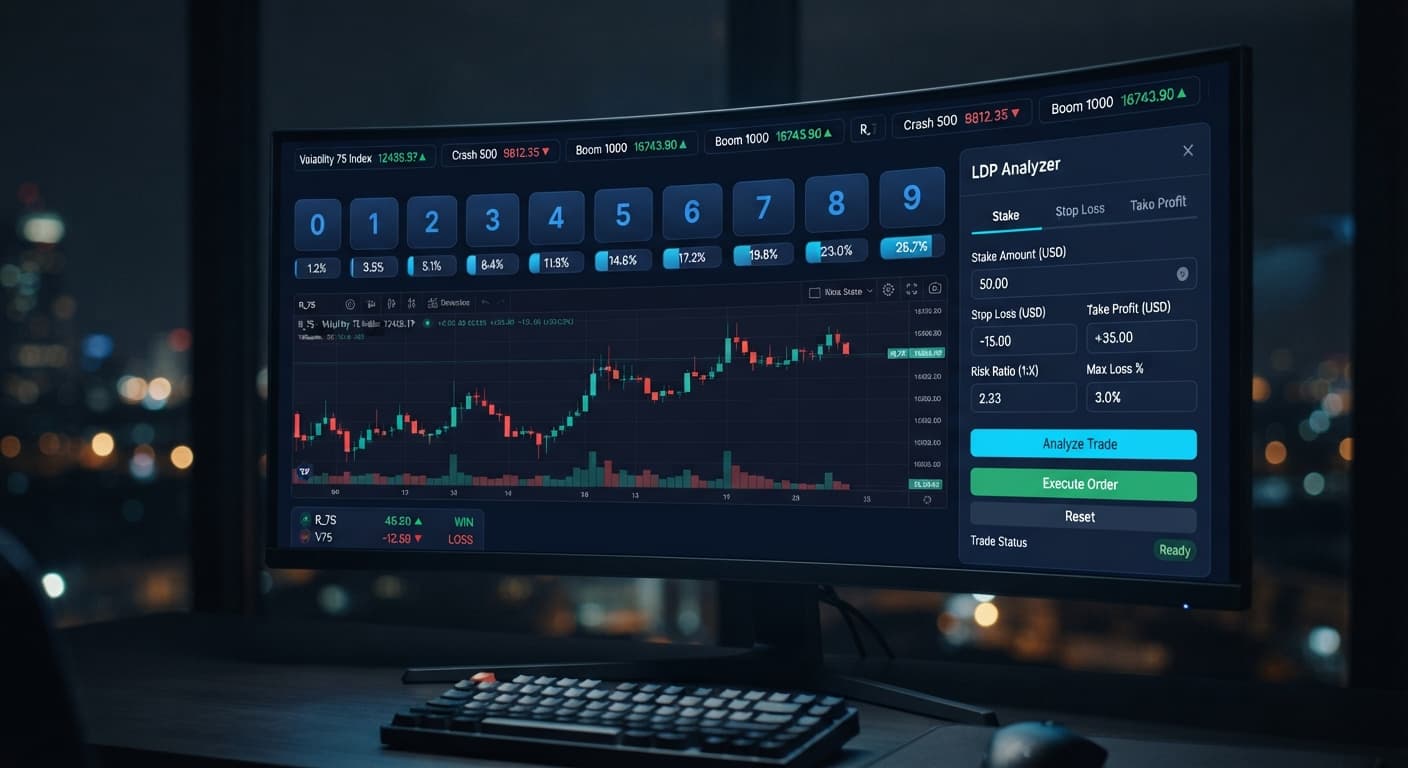
Here is how ldp analyzer risk settings explained in clear, practical terms: you configure your stake, stop loss, and take profit based on contract odds rather than account size. When running low-probability DIGITMATCH trades, a static stake set to 1% or less of your balance paired with a firm stop loss capped at 15 times your base trade prevents natural statistical drawdowns from wiping your account. Setting a hard take profit target locks in gains early before variance catches up with the stream.
The analyzer evaluates streaming tick data to trade single-digit outcomes on Deriv. To run this automation safely, you need to understand how different contract types handle payout and risk.
When you trade DIGITMATCH, you predict the exact last digit of the next price tick from 0 to 9. The mathematical probability of hitting a DIGITMATCH on any given tick is exactly 10%, giving payout multiples around 8.5x to 9x depending on market conditions. Its opposite is DIGITDIFF, where you win if the last digit does not match your chosen number. A DIGITDIFF trade wins 90% of the time, but offers small payouts relative to the risked amount.
Other contract types split the outcome space differently:
+-------------------------------------------------------------------+
| Digits:  0   1   2   3   4   |   5   6   7   8   9                |
|          |----------- DIGITUNDER 5 -----------|                   |
|                              |----------- DIGITOVER 4 -----------|
+-------------------------------------------------------------------+
The browser-based tool streams live price updates and logs individual digit frequencies. However, the software does not alter contract payouts or underlying math. Every tick generated by Deriv synthetic index algorithms is completely independent of the previous one.
Order execution relies on the exact pace at which ticks generate on your chosen market. Standard synthetic indices update every two seconds, while 1s variants process an update every single second.
If you set an automated strategy to run over a fixed duration, execution speed directly dictates your exposure to price shifts. The table below outlines how time elapses across standard and fast-tick markets on Deriv.
| Market Name | Tick Frequency | 5 Ticks Duration | 10 Ticks Duration | 20 Ticks Duration | 50 Ticks Duration | Execution Delay |
|---|---|---|---|---|---|---|
| Volatility 10 | 1 tick / 2 sec | 10 seconds | 20 seconds | 40 seconds | 100 seconds | ~150 ms |
| Volatility 25 | 1 tick / 2 sec | 10 seconds | 20 seconds | 40 seconds | 100 seconds | ~150 ms |
| Volatility 50 | 1 tick / 2 sec | 10 seconds | 20 seconds | 40 seconds | 100 seconds | ~150 ms |
| Volatility 75 | 1 tick / 2 sec | 10 seconds | 20 seconds | 40 seconds | 100 seconds | ~150 ms |
| Volatility 100 | 1 tick / 2 sec | 10 seconds | 20 seconds | 40 seconds | 100 seconds | ~150 ms |
| Volatility 10 (1s) | 1 tick / 1 sec | 5 seconds | 10 seconds | 20 seconds | 50 seconds | ~120 ms |
| Volatility 25 (1s) | 1 tick / 1 sec | 5 seconds | 10 seconds | 20 seconds | 50 seconds | ~120 ms |
| Volatility 50 (1s) | 1 tick / 1 sec | 5 seconds | 10 seconds | 20 seconds | 50 seconds | ~120 ms |
| Volatility 75 (1s) | 1 tick / 1 sec | 5 seconds | 10 seconds | 20 seconds | 50 seconds | ~120 ms |
| Volatility 100 (1s) | 1 tick / 1 sec | 5 seconds | 10 seconds | 20 seconds | 50 seconds | ~120 ms |
On a standard Volatility 75 index, a 10-tick trade holds your open position for 20 full seconds. On a Volatility 75 (1s) index, that same 10-tick trade resolves in 10 seconds. Network latency between your browser and the WebSocket connection adds roughly 120 to 150 milliseconds to the order submit phase, meaning your entry lands within the initial 15% window of the setup tick.
Running automated scripts using deriv bots requires precise entry parameters on your dashboard before initiating trades. Follow these steps to configure your session safely on LDP Analyzer:
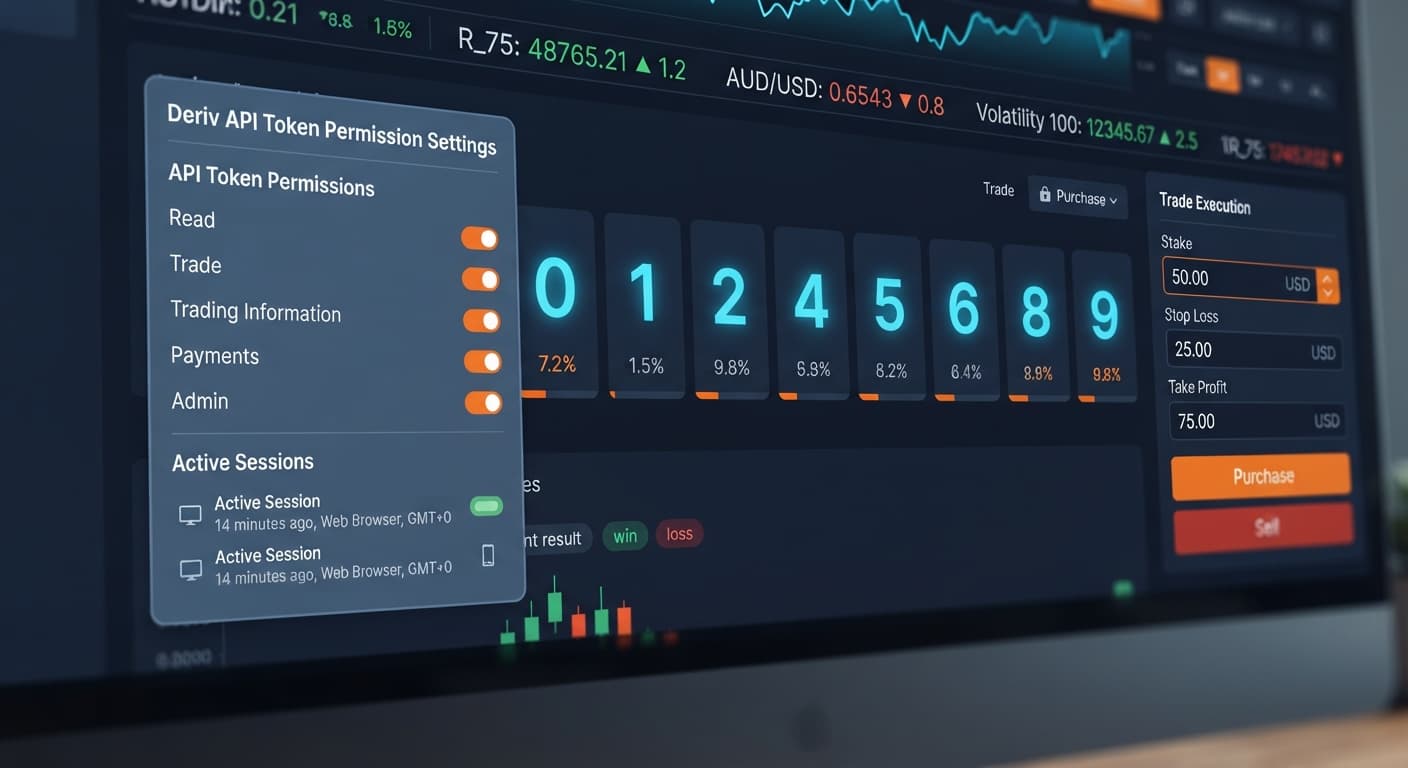
Paste your read/trade API token directly into the Deriv API token connection field. This establishes a direct WebSocket connection between your browser and Deriv without third-party server involvement.
Open the market selector dropdown and pick your target index. Options include Volatility 10, Volatility 25, Volatility 50, Volatility 75, Volatility 100, and their corresponding 1s variants.
Navigate to the stake field and enter your base amount. If your balance is $100, a stake of $1.00 ensures you don't over-expose your capital on low-probability setups like DIGITMATCH.
Enter your exit parameters into the stop loss and take profit input boxes. Setting a stop loss of $15.00 and a take profit of $10.00 creates clear boundary conditions for your automated session.
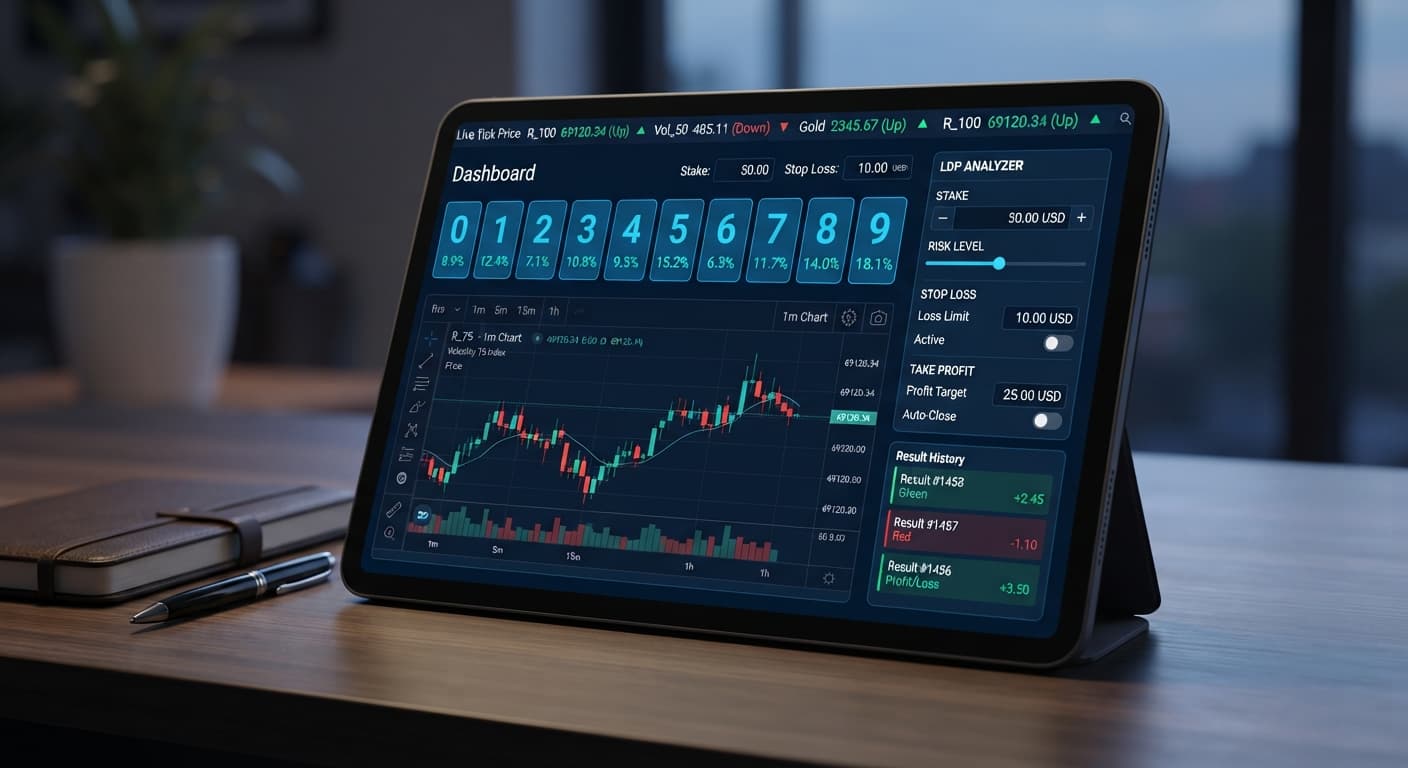
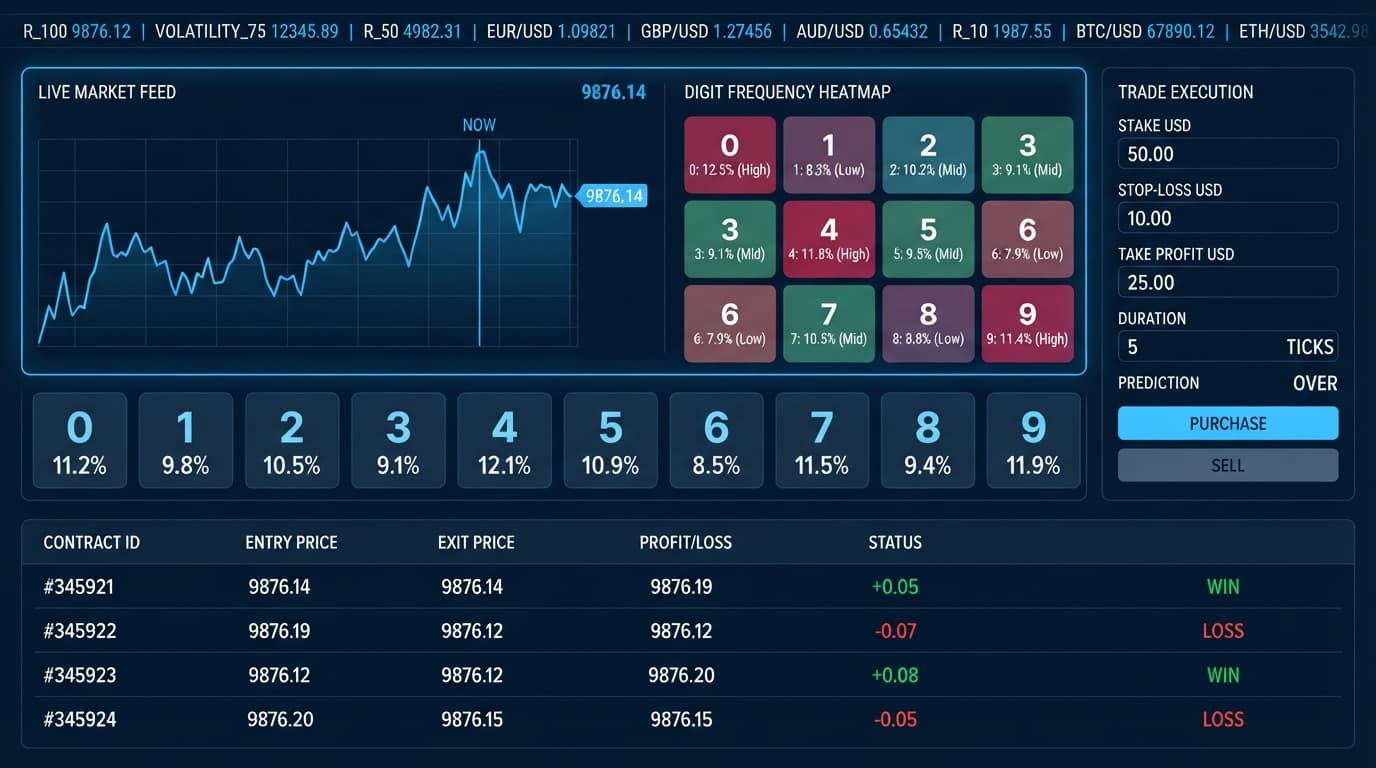
Choose between real-time digit analysis to monitor tick statistics visually, or enable automated strategy execution to let the tool process entries based on your active configuration.
Using web-based binary bots gives you speed, but failure to input strict limits in Step 4 leaves your balance vulnerable if market variance hits an extended losing run.
A common error traders make with digit statistics is falling for the gambler's fallacy. If digit 7 hasn't appeared for 30 consecutive ticks on Volatility 100, it's tempting to think digit 7 is "due" to hit on the next tick.
It isn't.
Deriv synthetic indices generate digit outputs using cryptographic random number generators. Each tick is an independent event. The probability of hitting a specific last digit on any single tick is always exactly 10%:
$$\text{Probability} = \frac{1}{10} = 0.10 \quad (10%)$$
Seeing a digit drop to zero occurrences over a 50-tick sample doesn't mean its probability on tick 51 rises to 20% or 50%. It remains strictly 10%.
When running automated strategy execution on DIGITMATCH contracts, you can easily experience 20 or 30 consecutive losses without a single hit. The underlying analyzer displays statistical history, but historical frequency never forces future outcomes. If your strategy depends on historical digit "rebound" patterns without hard numeric protection, random distribution spikes will drain your trading account.
Because LDP Analyzer places trades directly via fixed parameter entries, your protection depends entirely on how you define your risk fields before launching a script. The tool doesn't feature built-in martingale scaling or automated multiplier logic. Every trade uses the static value defined in your stake box.
Here are the exact session configurations you should enforce based on contract selection:
+----------------------------------------------------------------------+
|                         SESSION RISK LIMITS                          |
|                                                                      |
|  [ Account Balance: $100.00 ]                                        |
|  ├── Fixed Stake: $1.00 (1% of bankroll)                             |
|  ├── Hard Stop Loss: $15.00 (15 losses max)                          |
|  └── Take Profit Target: $9.00 (1 successful DIGITMATCH hit)         |
+----------------------------------------------------------------------+
stake to a maximum of 1% of your available account balance. On a $200 balance, your standard stake should be $2.00.stop loss to roughly 15 times your single trade amount. If your stake is $1.00, set your stop loss to $15.00. This caps your session loss to a maximum of 15 straight non-matches.take profit slightly below one full payout win (e.g., $8.50 on a $1.00 stake) so the bot halts execution immediately after securing a hit.Try it yourself on LDP Analyzer using a demo balance first.
If you don't have one yet, create a free Deriv account.
Trading involves risk. Past performance does not guarantee future results.
Related: Is LDP Analyzer Safe for Volatility Indices Trading?
Related: LDP Analyzer Small Account Strategy: Stake & Stop Loss Setup
Free LDP Binary Analyzer — AI-powered last-digit analysis for Deriv traders with real-time binary analysis and automated strategies.
Open LDP Analyzer →You should configure your stake, stop loss, and take profit based on contract odds rather than your account size. Set a static stake to 1% or less of your balance, pair it with a firm stop loss capped at 15 times your base trade, and use a hard take profit target to lock in gains early.
The mathematical probability of hitting a DIGITMATCH on any given tick is exactly 10%. This gives payout multiples ranging around 8.5x to 9x depending on current market conditions.
With DIGITDIFF, you win if the last digit does not match your chosen number, which wins 90% of the time but offers small payouts relative to your risked amount. In contrast, DIGITMATCH requires you to predict the exact last digit from 0 to 9, offering higher payouts around 8.5x to 9x with a 10% probability.
Standard synthetic indices update every two seconds, while 1s variants process an update every single second. This execution speed directly dictates your exposure to price shifts when running automated strategies over a fixed duration.
Guides closest to this one.
Follow these 5 steps to use the ldp analyzer on volatility 25, connect your Deriv API token, and set your stake, stop loss, and take profit limits.
Find out if ldp analyzer safe for trading Deriv synthetic indices by examining technical security, API tokens, tick latency, and random number generators.
Set your stake to $0.35, stop loss to $3.00, and take profit to $2.00 with this ldp analyzer small account strategy for a $20 Deriv account balance.