Strategies & Risk
Best Over Under Settings for Binary Bots (2026)
Use DIGITOVER 2 with a 5-tick duration and Multi Shot's Recovery to find the best over under settings for binary bots on Deriv.
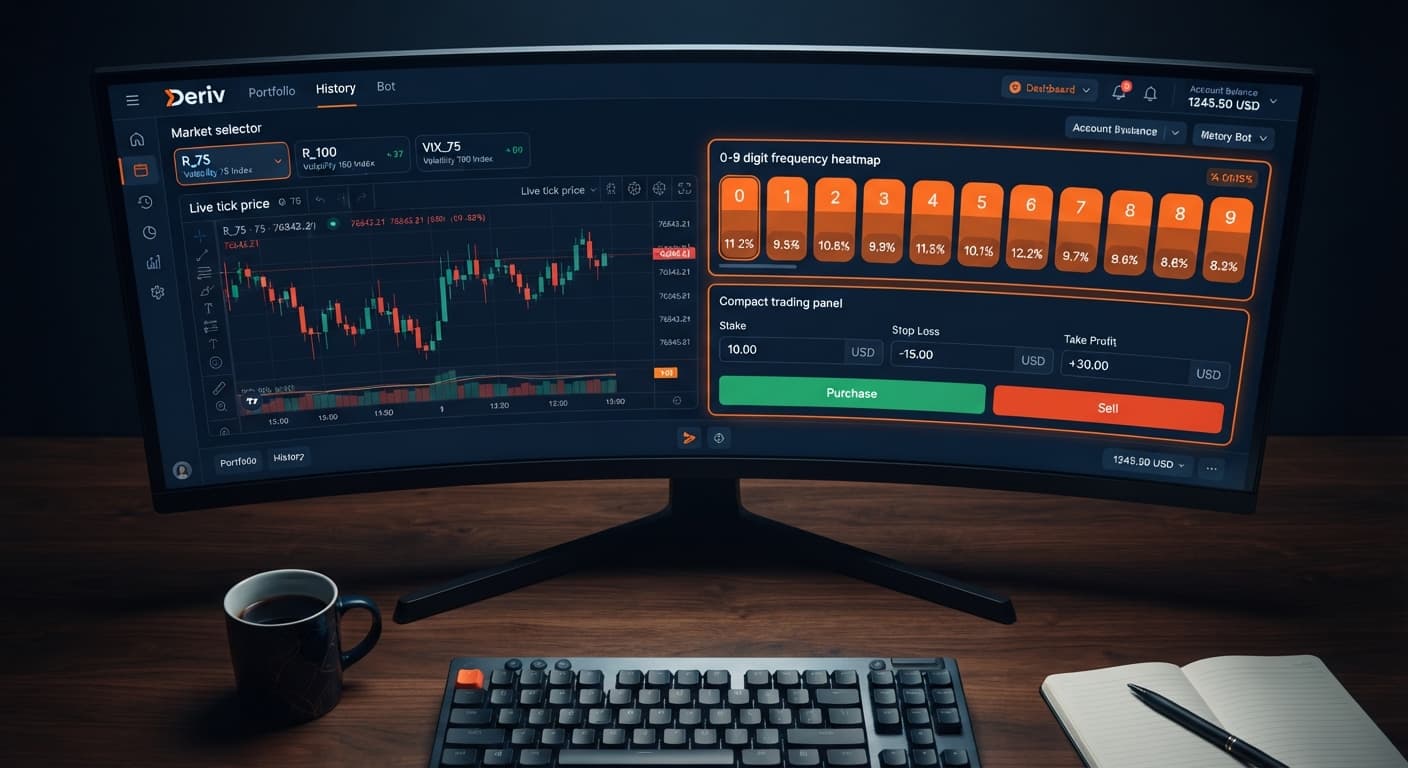
Understanding digit psychology in deriv comes down to recognizing human cognitive bias: the irrational belief that past digit patterns dictate future outcomes. On synthetic markets, every tick is statistically independent, meaning five consecutive even digits won't increase the probability of an odd digit appearing next. Traders fall into traps when they treat random tick streams as predictable sequences, leading to emotional revenge trading after unexpected losing runs.
By following this guide, you'll set up a real-time digit analyzer that runs automated trade logic based on exact statistical criteria. You'll link your account, configure digit distribution metrics, and apply firm risk controls using binary bots without relying on dangerous gut feelings.
Before configuring any automated digit analyzer, prepare the following items:
Navigate to use the LDP Analyzer interface. Locate the API Token input field near the top header of the interface. Paste your token into the box and click the Connect button.
Once submitted, the tool connects directly to Deriv over their official API without sending account credentials to third-party servers. When successful, the connection indicator changes from a red "Disconnected" tag to a green "Connected" status, displaying your current account balance and active currency.
Choose your target market from the Market selection menu, such as Volatility 100 (1s) Index. Next, locate the Tick Count setting field, which defines the statistical window used for calculating last-digit frequencies.
Enter a value of 100 into the Tick Count field. The dashboard will instantly populate a real-time distribution chart showing the percentage frequency of digits 0 through 9 across the last 100 ticks.
Select your desired contract type from the available options: DIGITDIFF, DIGITMATCH, DIGITEVEN, DIGITODD, DIGITOVER, or DIGITUNDER. For this setup, select DIGITEVEN.
Set your entry rule based on raw percentage thresholds rather than gut feel. Configure the logic trigger to purchase a DIGITEVEN contract only when the analyzer detects the Even digit total falling below 40% across the sample window. Next, set your Money Management selection to Fixed Stake or Multi Shot's Recovery, entering an Initial Stake value of $1.00.
Locate the automated risk management fields before placing any orders. Enter your maximum acceptable session drawdown in the stop loss field (e.g., $15.00). In the take profit / target profit field, enter your session growth objective (e.g., $5.00).
If you select a sequential strategy like Martingale or D'Alembert, locate the max ladder level input and set it to 3. This hard limit prevents your automated runner from endlessly increasing stakes during extended statistical anomalies.
Click the Start Bot button to initiate automated trade execution. The system status indicator will switch to "Running" and begin evaluating every incoming market tick against your defined threshold.
Keep the browser window active while trading. The live event log below the control panel will stream real-time contract entries, purchase price calculations, payout balances, and session totals.
Automated execution requires visual confirmation of dashboard states. The table below outlines what your browser displays during normal operation, system warnings, and execution triggers.
| UI Indicator / Region | Screen Visual State | Operational Meaning | Direct Action Required |
|---|---|---|---|
| Connection Badge | Green text: "Connected (Demo)" | API connection verified and ready | Proceed to configure strategy inputs |
| Last Digit Chart | Bar peak highlighted at 18% | Digit frequency statistical distribution | Monitor percentage drift before execution |
| Execution Status Banner | Flashing blue: "Analyzing Ticks" | System actively listening to tick feed | Allow bot to run; do not alter settings |
| Trade Log Window | Entry reading "Win +$0.95" or "Loss -$1.00" | Contract settled; balance updated live | Check cumulative profit against target profit |
| Session Summary Counter | Red highlighted card: Stop Loss Reached | Account hit safety limit; bot halted | Review log data; do not restart immediately |
Traders using deriv bots frequently fall victim to predictable behavioral patterns. Here's how to counter those habits with exact system controls built into the free bot library.
A common bias in digit psychology in deriv is assuming a digit that hasn't appeared recently is bound to show up on the next tick. Synthetic ticks are generated randomly; past distribution never influences the next digit.
When a session experiences consecutive losing trades, traders often panic and delete their risk controls to attempt quick recovery.
Using aggressive money management modes like Martingale without capping sequence steps can quickly wipe out an account balance during a bad streak.
Browser throttles, internet disconnects, or unexpected API rate limits can stall automated strategies, leaving open positions unmonitored.
Try it yourself on the free tools using a demo balance first.
If you don't have one yet, create a free Deriv account.
Trading involves risk. Past performance does not guarantee future results.
Related: Digit Match Strategy Deriv Bots: Setup & Risk Controls
Related: Digit Differs Strategy Deriv Bots: Vol 10 Guide
Related: Configuring the Best Digit Differs Settings for Binary Bots
Related: Even Odd Strategy Deriv Bots on Volatility 10 (1s) Index
How the strategies behind the bots actually work — Digit Differs, Over/Under, Even/Odd, Rise/Fall, and the money management that decides whether they survive a losing streak.
Try 9 Strategies on Solid →You'll need a Deriv trading account and an API token generated with both Read and Trade scopes enabled in your account settings. You also need an active web browser session connected to the analyzer interface and predefined risk limits.
Paste your API token into the input field near the top header of the LDP Analyzer interface and click the connect button. Once connected successfully, the indicator will change from a red disconnected tag to a green connected status.
You should enter a value of 100 into the tick count field to set the statistical window. This instantly populates a real-time distribution chart showing the percentage frequency of digits 0 through 9 across the latest ticks.
No, past patterns don't predict future outcomes because every tick on synthetic markets is statistically independent. Believing that a streak of even digits increases the odds of an odd digit is a cognitive bias known as digit psychology.
Guides closest to this one.
Use DIGITOVER 2 with a 5-tick duration and Multi Shot's Recovery to find the best over under settings for binary bots on Deriv.
Deploying even odd strategy deriv bots on the Volatility 10 (1s) Index targets 50/50 probability digit payouts with a fast 1-second tick speed.
Master a digit match strategy deriv bots setup for 800% payouts on synthetic indices by managing long tick droughts and configuring strict risk controls.