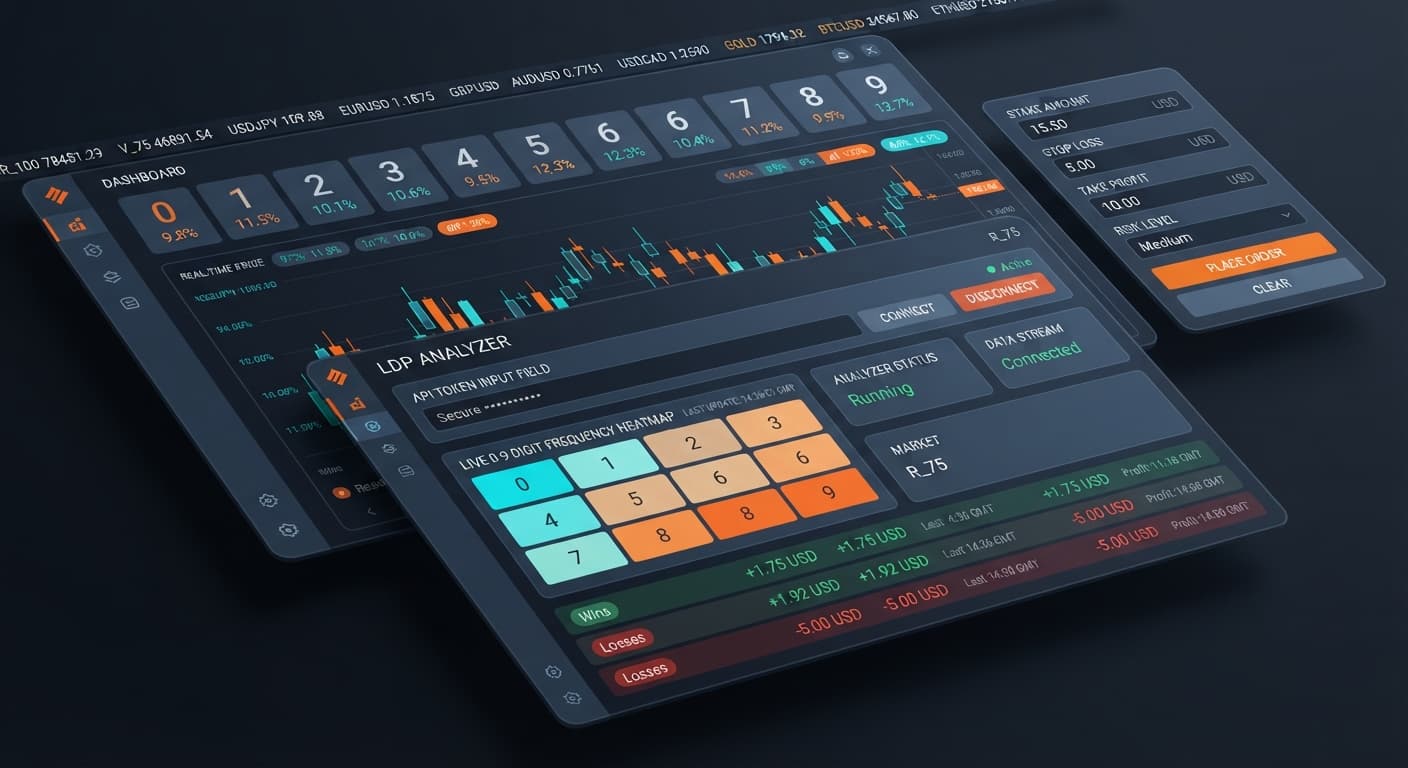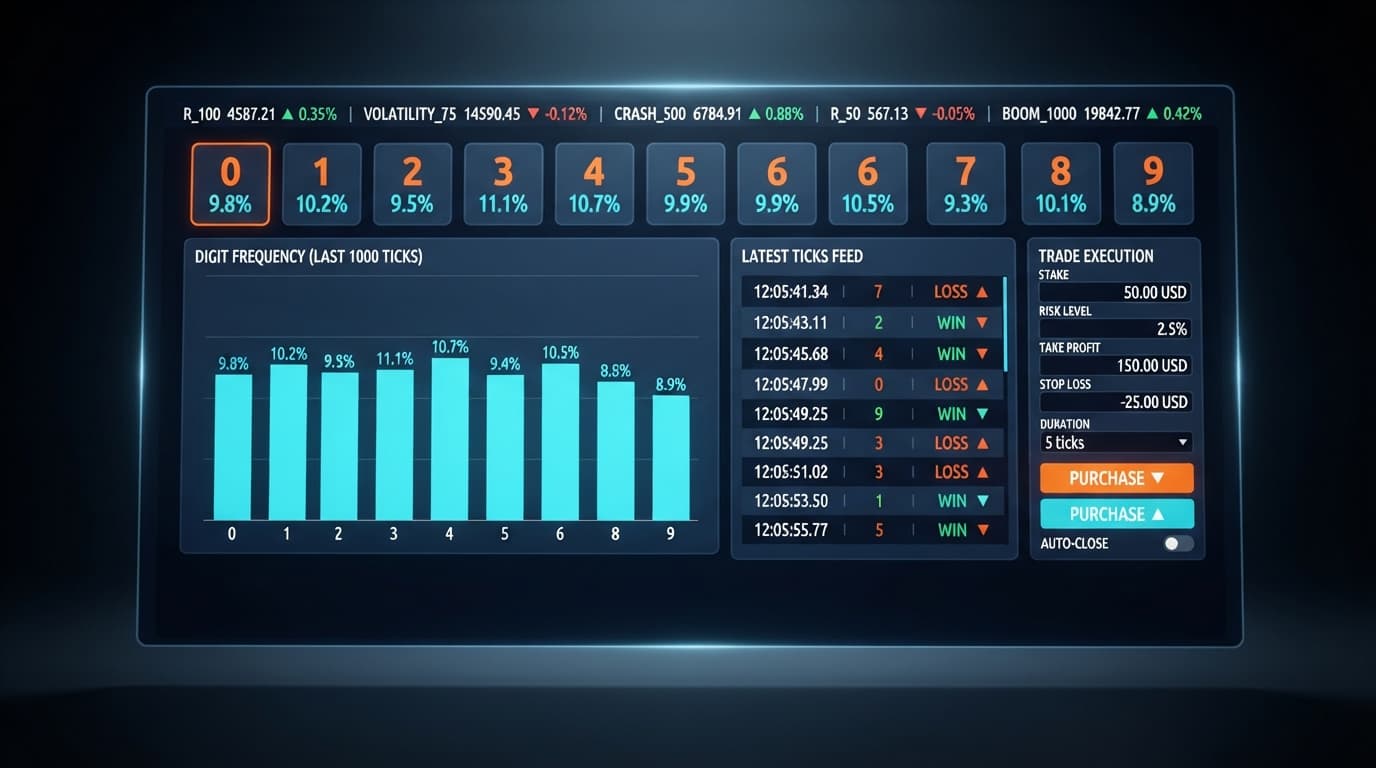
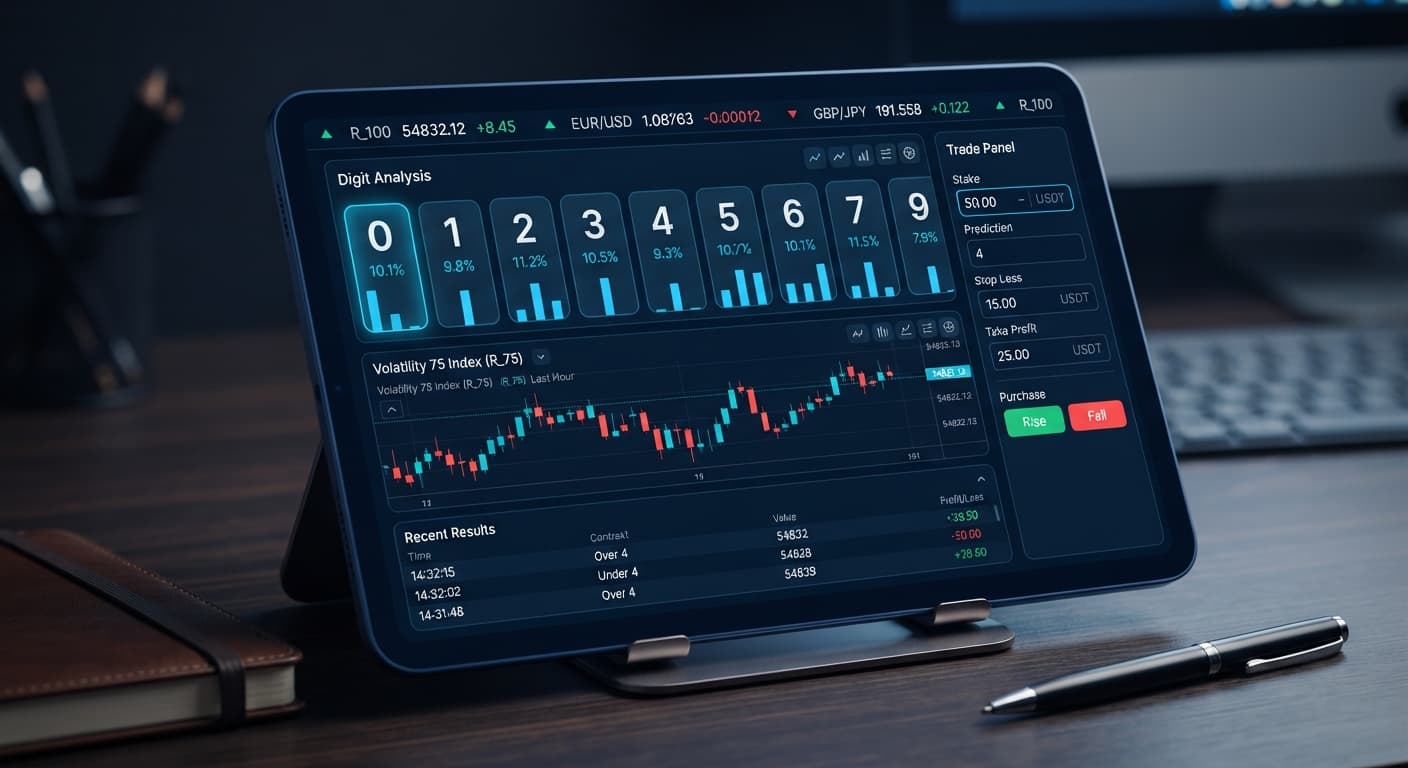
Digit Analysis
Why LDP Analyzer Keeps Losing for Deriv Bots
Discover why your ldp analyzer keeps losing on Deriv bots. Learn how to fix stake sizes, stop loss, and take profit settings. Test strategies for free today.
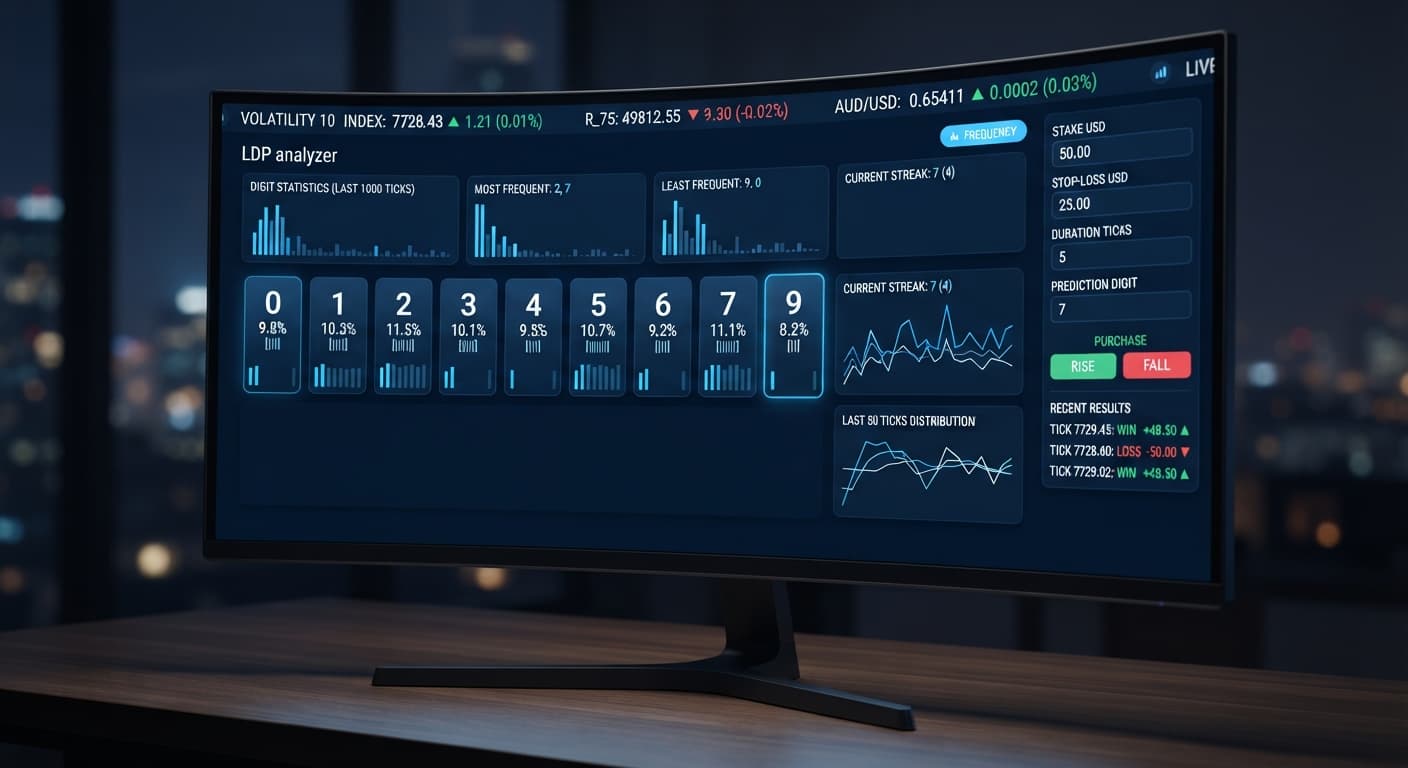
The ldp analyzer best market for standard digit contracts on binary bots is the Volatility 10 (1s) Index because it delivers an exact 1-tick-per-second pulse without erratic tick clustering. It suits traders using automated strategy execution for DIGITEVEN, DIGITODD, DIGITOVER, or DIGITUNDER contracts who need steady, real-time digit analysis to evaluate digit frequencies cleanly. Choosing this market removes the irregular delays common on standard volatility indices while keeping overall volatility low enough for predictable tick updates.
Deriv creates its synthetic index price feeds using an audit-verified random number generator. The algorithm outputs last digits strictly based on mathematical probability, meaning each tick's last digit is an independent draw from 0 to 9. The percentage label on an index—whether Volatility 10, Volatility 25, Volatility 50, Volatility 75, or Volatility 100—reflects price distance movement over time, not digit frequency or bias.
On standard synthetic markets like the classic Volatility 10 Index, ticks generate roughly every two seconds, but the timing varies. Internet routing and server ticks can push individual updates anywhere between 1.2 seconds and 2.8 seconds apart. That variability doesn't break the math, but it makes real-time binary analysis harder to track on screen.
When you adjust your market selector inside the LDP Analyzer to the Volatility 10 (1s) Index, the feed updates every 1000 milliseconds without pause. That exact timing gives your digit analysis engine a stable data stream. The last digit prediction tool parses each price point straight from the stream without missing ticks or catching up in sudden bursts. Because digit contracts evaluate only the final digit of the spot price at contract expiry, price distance doesn't change your win condition. Steady timing ensures your browser submits trades right on tick boundaries without latency drift.
Finding the ldp analyzer best market requires looking at how time moves on screen during an active trade. On standard synthetic indices, a 10-tick contract duration can take 18 seconds or 24 seconds depending on network conditions. On 1-second indices, ticks and seconds align directly.
Here's the exact timing sequence when running automated strategy execution on the Volatility 10 (1s) Index:
| Market Choice | 10-Tick Duration | 20-Tick Duration | 50-Tick Duration | Average Tick Timing Variance |
|---|---|---|---|---|
| Volatility 10 | ~18.5 seconds | ~38.0 seconds | ~97.0 seconds | High (±1.2 seconds) |
| Volatility 25 | ~19.0 seconds | ~39.5 seconds | ~98.5 seconds | Moderate (±0.9 seconds) |
| Volatility 100 | ~17.8 seconds | ~36.2 seconds | ~92.0 seconds | High (±1.5 seconds) |
| Volatility 10 (1s) | 10.0 seconds | 20.0 seconds | 50.0 seconds | Zero ( exact 1.0s ticks ) |
This precision is why traders running binary bots prefer 1s markets. When you evaluate digit frequency, predictable time intervals keep your interface in sync with server processing.
Before starting any session, configure your parameters inside the analyzer interface. Type in your initial stake, and establish your stop loss and take profit limits before turning on automated triggers.
| Target Contract | Recommended Duration | Starting Stake | Stop Loss Limit | Take Profit Target | Strategy Rationale |
|---|---|---|---|---|---|
| DIGITEVEN / DIGITODD | 1 to 5 Ticks | $1.00 | $15.00 | $5.00 | Baseline 50/50 payout; short duration limits extended exposure. |
| DIGITOVER 2 | 1 to 3 Ticks | $1.00 | $20.00 | $6.00 | ~70% win probability per tick; lower payout balanced by frequent wins. |
| DIGITUNDER 7 | 1 to 3 Ticks | $1.00 | $20.00 | $6.00 | ~70% win probability per tick; steady hit rate over brief intervals. |
| DIGITMATCH | 1 Tick | $0.35 | $10.00 | $10.00 | Pays roughly 10x stake; small stake protects balance while waiting for match hits. |
| DIGITDIFF | 1 Tick | $2.00 | $25.00 | $5.00 | Pays |
Keep your base stake low—ideally 1% to 2% of your overall session capital. If you want expanded tools like a full 0-9 digit heatmap, custom DIFFER/MATCH targets, or auto-trader controls, you can open the LDP Analyzer Pro dashboard to upgrade your setup. The core analyzer offers everything required for manual oversight and entry triggers on base contracts.
The most common mistake traders make when moving from high-volatility indices like Volatility 100 or Volatility 75 to Volatility 10 (1s) is treating digit draws like price momentum.
On Volatility 100, price bars make large visible jumps on charts. That visual movement leads people to believe digits are changing faster or following price trends. When those same traders select Volatility 10 (1s) on the market selector, price ticks move in tiny micro-steps. Traders often assume that small price movement means last digits will repeat or cluster on even or odd numbers.
That assumption is wrong. Every tick drawn on Deriv synthetic indices is completely independent of the previous one. Seeing five DIGITEVEN outcomes in a row does not make DIGITODD more likely on tick six. The statistical chance for DIGITEVEN remains exactly 50% on every single draw.
Another frequent mistake involves manual stake management. When traders encounter a few losses, they often increase their stake manually without sticking to their preset rules. Martingale stake progression can wipe an account during a long losing streak—the stake doubles far faster than most traders expect. LDP Analyzer does not contain an automated martingale control. Trying to manually double stakes on fast 1-second ticks leads to poor timing and blown accounts.
Always test your configurations on a Deriv demo account before trading live. Confirm how your stop loss and take profit behave under live market conditions before risking real capital. You can test additional strategies across different instruments by visiting the free Deriv bot library.
This article is for educational purposes only and does not constitute financial advice.
Try running your digit parameters on LDP Analyzer using a virtual balance first. If you need an account to get started, create a free Deriv account before testing live feeds. Trading involves risk. Past performance does not guarantee future results.
Related: LDP Analyzer Review: Digit Stats & Deriv Bots
Related: Configuring LDP Analyzer Settings for Deriv Bots
Related: Using Ldp Analyzer For Beginners On Deriv Binary Bots
Free LDP Binary Analyzer — AI-powered last-digit analysis for Deriv traders with real-time binary analysis and automated strategies.
Open LDP Analyzer →The Volatility 10 (1s) Index is the best market because it delivers an exact 1-tick-per-second pulse without erratic tick clustering. It provides a stable data stream that helps you evaluate digit frequencies cleanly when using the LDP Analyzer.
Standard indices have variable tick timing that makes real-time binary analysis harder to track on screen. In contrast, the 1-second index updates every 1000 milliseconds without pause, preventing the irregular delays and latency drift common on standard markets.
Ticks and seconds align directly on 1-second indices so that contracts expire precisely on the second. For example, a 10-tick contract expires in exactly 10.0 seconds, and a 50-tick contract expires in exactly 50.0 seconds.
Price distance doesn't change your win condition because digit contracts evaluate only the final digit of the spot price at contract expiry. The percentage label on an index only reflects price movement over time, while each tick's last digit is an independent draw from 0 to 9.
Guides closest to this one.
Discover why your ldp analyzer keeps losing on Deriv bots. Learn how to fix stake sizes, stop loss, and take profit settings. Test strategies for free today.
Use ldp analyzer india for binary bots. Learn how to connect your Deriv API token and run real-time digit analysis today. Start reading now.
Read our comprehensive ldp analyzer review for binary bots. Learn digit analysis, supported markets, and risk management tools on Deriv. Try it today!