Deriv Basics
How to Check Digit Contracts on BinaryBot.live
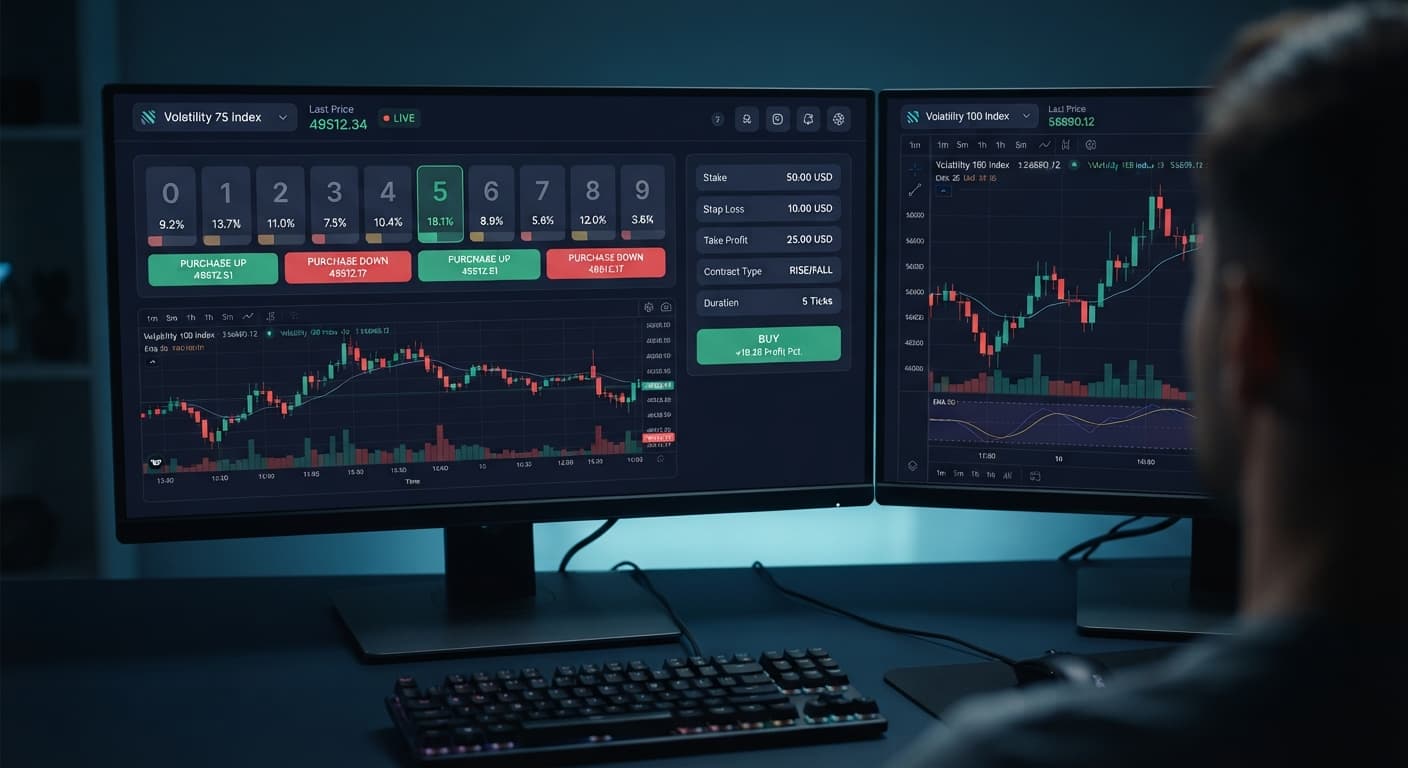
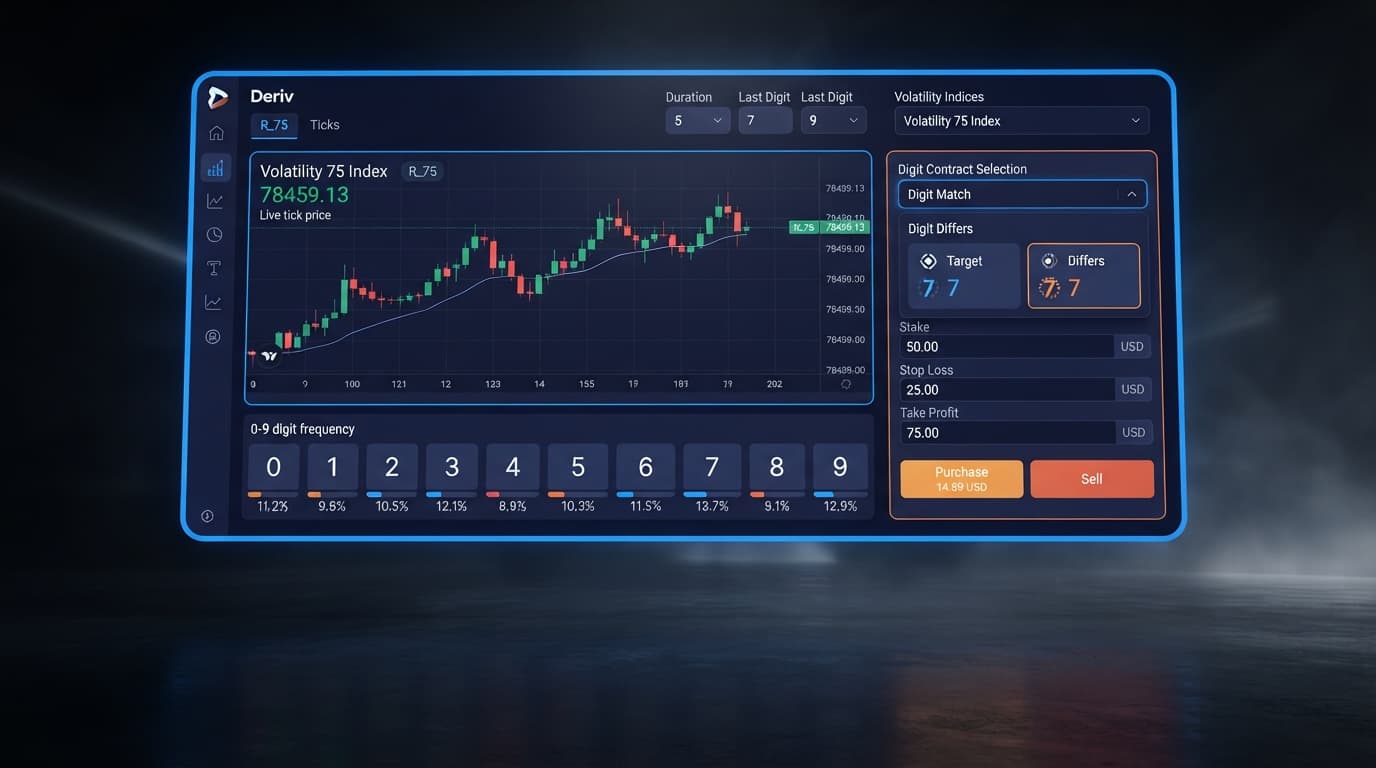
Deriv synthetic index digit contracts settle against the final decimal digit of a tick from 0 to 9, supporting Even, Odd, Over, Under, Match, and Diff types.
The ldp analyzer best time to trade digit contracts on Deriv is whenever short-term statistical variance creates a clear digit frequency imbalance across a 50-tick to 100-tick window. Because synthetic indices run 24 hours a day on computer-generated algorithms, traditional clock-based market hours don't dictate trade quality. Instead, the best entry points appear when cold or hot digits drift significantly away from their long-term 10% theoretical average.
This guide walks through how to read digit distribution data, calculate exact mathematical break-even thresholds across contract types, and execute structured testing with popular deriv bots without risking real money until your approach is proven.
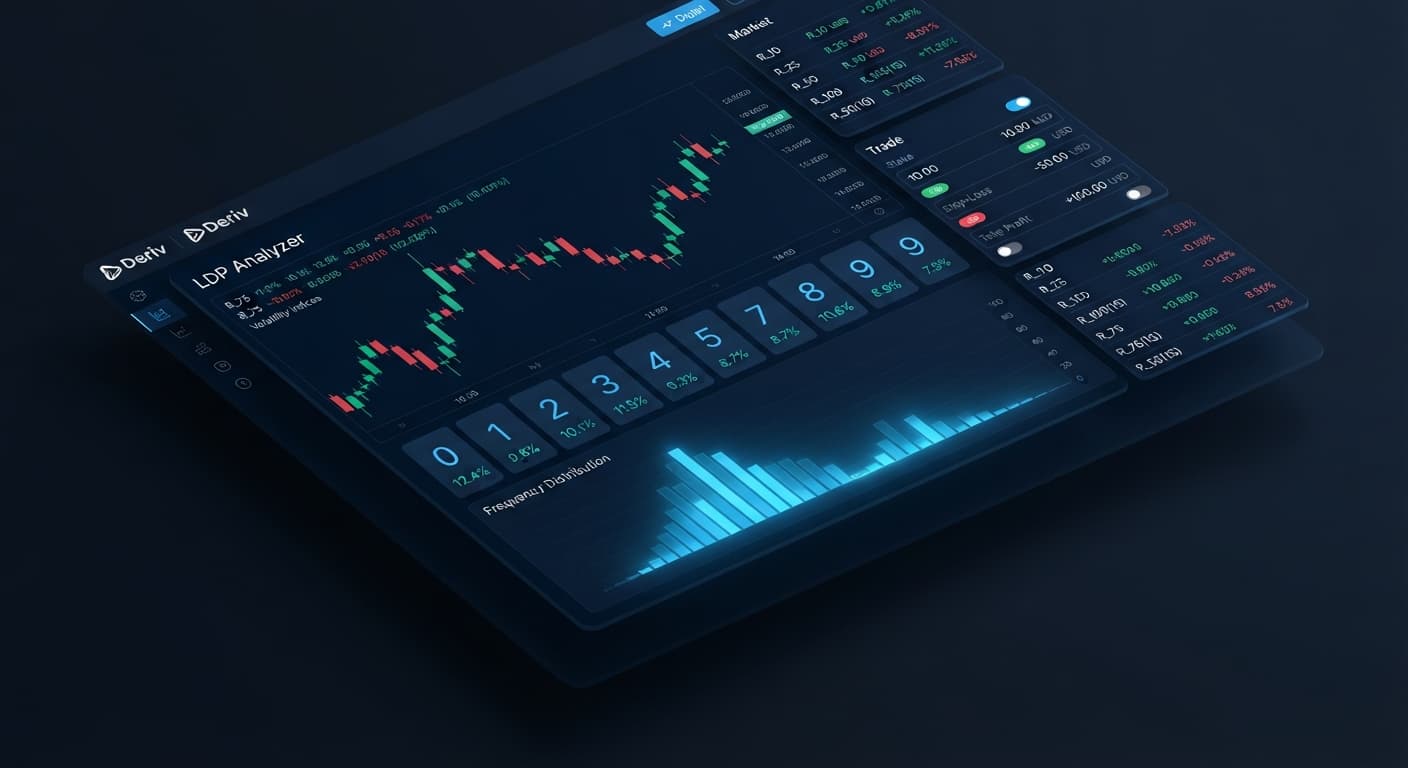
An Last Digit Prediction (LDP) analyzer works by opening a connection directly to Deriv over their official API. As new tick data streams in, the analyzer isolates the final decimal digit of each price point and builds a live frequency distribution table.
If you inspect a tool like the free LDP Analyzer dashboard, it tallies occurrences of digits 0 through 9 over your selected tick depth—typically 25, 50, or 100 ticks.
Tick Stream -> Isolate Last Digit -> Update Frequency Table -> Highlight Clustered Digits
Here is what the tool actually does for you:
Here is what the tool does not do:
Every tick generated on a synthetic index is an independent statistical event. An LDP tool simply reveals where historical variance currently sits, allowing you to align your entry with measurable skew rather than random guessing.
Before executing trades with automated binary bots, you must understand the mathematical baseline of digit payouts. The house edge on synthetic digit contracts comes from the gap between actual statistical probability and payout multipliers.
On a fair 10-digit system (0 through 9), each digit holds a raw 10% probability on any single tick. Choosing a contract type changes both your probability of winning and the payout received.
| Contract Type | Underlying Winning Conditions | Raw Statistical Win Rate | Typical Payout Multiplier | Required Break-Even Win Rate |
|---|---|---|---|---|
| DIGITEVEN | Last digit is 0, 2, 4, 6, or 8 | 50.00% | 1.95x (95% return) | 51.28% |
| DIGITODD | Last digit is 1, 3, 5, 7, or 9 | 50.00% | 1.95x (95% return) | 51.28% |
| DIGITUNDER 7 | Last digit is 0, 1, 2, 3, 4, 5, or 6 | 70.00% | 1.38x (38% return) | 72.46% |
| DIGITOVER 2 | Last digit is 3, 4, 5, 6, 7, 8, or 9 | 70.00% | 1.38x (38% return) | 72.46% |
| DIGITDIFF | Last digit does NOT match target prediction | 90.00% | 1.09x (9% return) | 91.74% |
| DIGITMATCH | Last digit EXACTLY matches target prediction | 10.00% | 8.50x (750% return) | 11.76% |
To calculate your required break-even hit rate for any contract, divide $1 by the total payout multiplier:
$$\text{Break-Even Rate} = \frac{1}{\text{Payout Multiplier}}$$
For instance, on a standard DIGITEVEN contract paying a 95% profit on top of your stake:
$$\frac{$1.00}{$1.95} = 0.5128 = 51.28%$$
If your strategy fails to clear 51.28% over a large sample of trades, account balance decay is mathematically inevitable.
When trading DIGITDIFF, your theoretical probability of winning is 90%. However, because the payout is roughly 9%, your break-even win rate is 91.74%. A single loss erodes the profits gained from ten consecutive wins. Using an LDP visualizer to identify when a target digit has appeared multiple times in short succession helps reduce entering a DIGITDIFF position right before a repeat occurrence.
Follow these precise steps to set up an analyzer session on a virtual account.
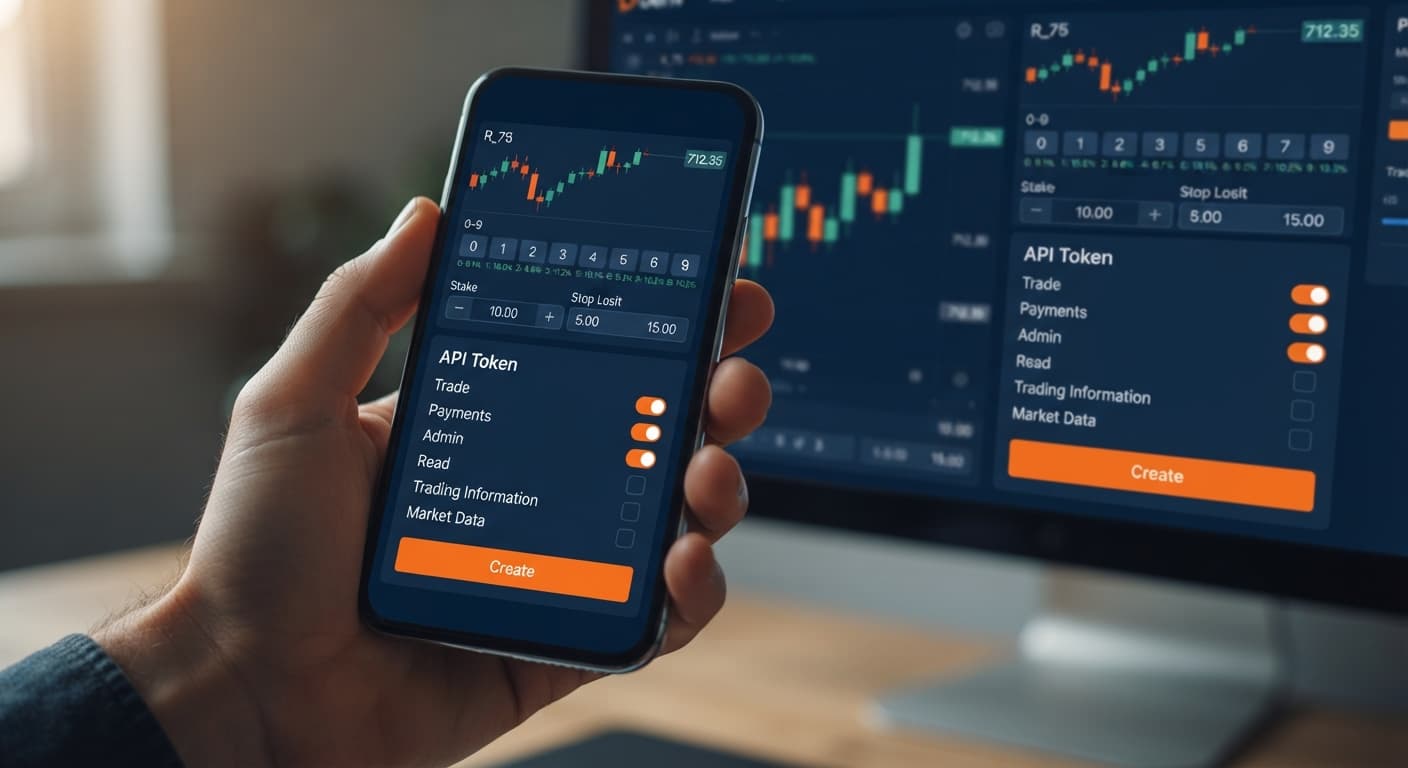
Log into your Deriv account, head to Account Settings, and locate the API Token menu. Create a new token named "LDP-Analyzer" and select only the read and trade checkboxes. Never check admin or payment scopes.
Open the LDP Analyzer Pro dashboard. Paste your API token directly into the connection panel. The connection happens inside your local web browser, sending direct instructions to Deriv without third-party wallet intervention.
Select a liquid synthetic asset, such as Volatility 100 (1s) Index. Change the tick sample depth from 25 to 100 ticks. A 25-tick sample reacts too fast to temporary noise, while a 100-tick sample shows meaningful distributional variance.
Look at the frequency distribution chart. Wait for an asymmetry where one digit falls below 4% occurrence (cold) or rises above 16% (hot) over the last 100 ticks.
Digit 0: [||||||||] 8%
Digit 1: [||||] 4%  <-- COLD TRIGGER
Digit 2: [||||||||||||||||] 16% <-- HOT TRIGGER
If you plan to execute manual trades using visual cues, open Digit Pad alongside your analyzer to manually trigger entries with minimal delay.
Run a batch of 20 consecutive test contracts on your demo balance. Track your actual hit rate against the break-even math shown in the table above. If you prefer running automated executions based on these digit triggers, test your parameters inside Solid Trading Bot or review pre-built strategies in the free bot library.
Determining the ldp analyzer best time to trade also means recognizing when to stay out of the market entirely.
An LDP analyzer is useless when market frequencies reflect uniform standard distribution. If every digit from 0 to 9 displays between 9% and 11% frequency over 100 ticks, there is no actionable statistical skew. Entering trades during flat distribution means operating at pure baseline probabilities, where broker margin fees slowly drag down capital.
Step away from the platform or switch back to your demo account whenever these conditions occur:
If you encounter high variance or consecutive losses while testing automated triggers, consider trying distinct execution modes using Sniper Bot V3 or testing structural variations on DualShot. Always return to virtual funds whenever switching strategies or running unfamiliar digit scripts built for binary bots.
Try running your digit analysis strategies on the free tools using a virtual balance first.
If you need a trading account to get started, create a free Deriv account.
Trading involves risk. Past performance does not guarantee future results.
Related: Free Binary Bots for Absolute Beginners (2026)
Related: Deriv Demo Account for Bots: Zero-Knowledge Setup Guide
Related: Deriv Bots Minimum Deposit: A Beginner Guide to Free Trading
Related: Zero Knowledge Guide to Deriv Digit Trading on BinaryBot.live
Related: Which Deriv API Token Scopes to Select for Beginners
The groundwork every bot guide assumes you already have — creating a Deriv API token, choosing demo vs real, and connecting safely.
Start with a Free Bot →There's no specific clock time because Deriv's synthetic indices run 24 hours a day on algorithms. Instead, the best time to trade is whenever short-term statistical variance creates a clear digit frequency imbalance across a 50 to 100-tick window.
It connects to Deriv via the official API to isolate the final decimal digit of each price point and build a live frequency distribution table. This lets you see hot and cold digits over a custom sample size, though it doesn't predict future ticks or guarantee wins.
It depends on your contract type because of the house edge and payout multipliers. For example, DIGITEVEN and DIGITODD require a 51.28% win rate to break even, while DIGITMATCH requires an 11.76% win rate.
Yes, you can execute structured testing using popular binary bots and free tools without risking real cash until you've proven your approach. Always test your strategy first since every tick is an independent statistical event with no guaranteed outcomes.
Guides closest to this one.
Deriv synthetic index digit contracts settle against the final decimal digit of a tick from 0 to 9, supporting Even, Odd, Over, Under, Match, and Diff types.
Select only Read and Trade API token scopes for automated Deriv strategies. Never select Payments or Admin scopes to protect your account funds.
Most beginners lose money during their first week of deriv digit trading because they treat random statistical outcomes like predictable trends.