Digit Analysis
LDP Analyzer Pro vs Solid Trading Bot on Deriv Bots
Compare ldp analyzer pro vs solid trading bot on Deriv synthetic indices. Learn live 0-9 heatmap analysis versus rule-based execution. Test it today.
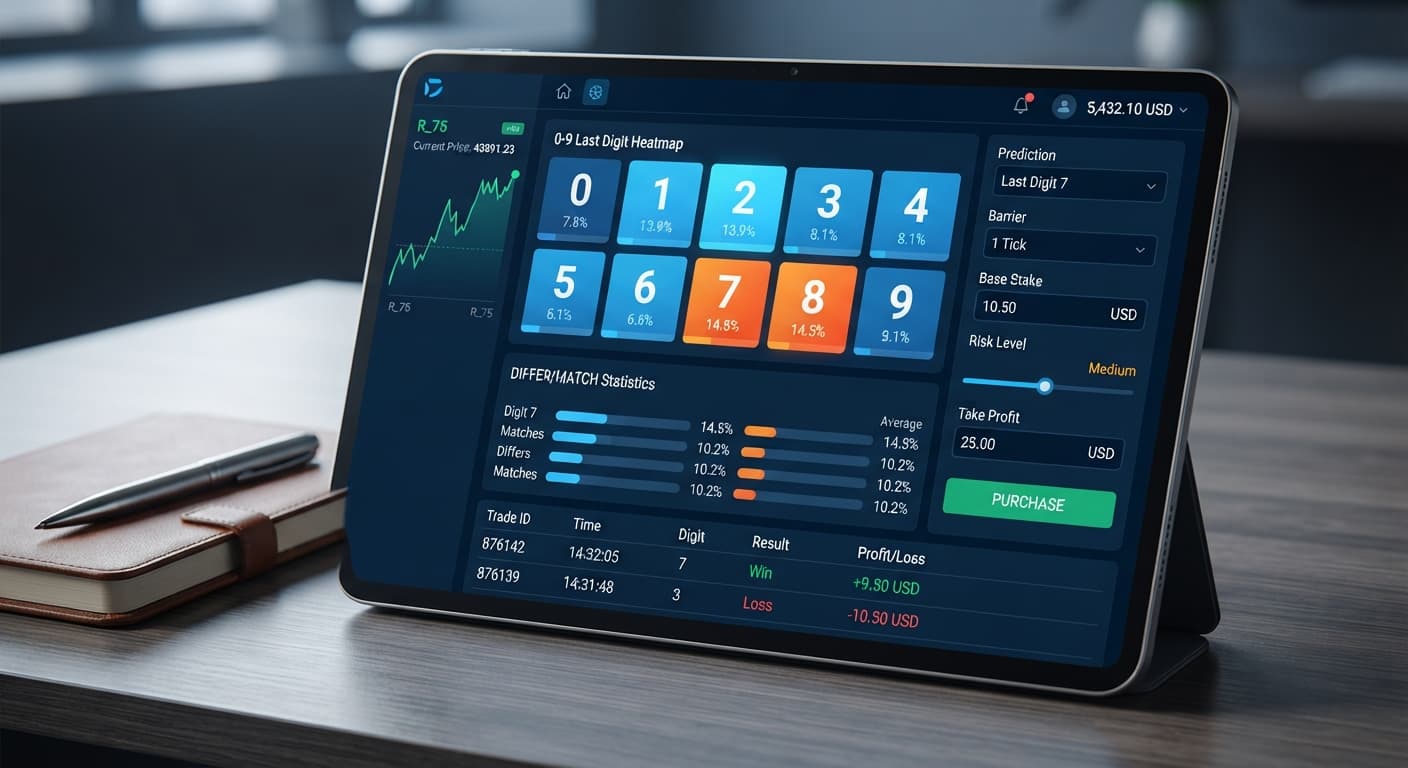
An ldp analyzer pro demo account setup requires creating a virtual API token inside your Deriv account settings, connecting that key to the browser dashboard, and setting hard stake limits on virtual funds before turning on automated triggers. This configuration lets you test execution speeds, AI signal thresholds, and digit statistics across synthetic indices without risking cash. It's built for traders who want to run digit strategies like Over/Under or Match/Differ on demo balances before moving to live trading.
The single most critical step in an ldp analyzer pro demo account setup is generating and connecting a demo API token rather than a real one. If you grab an API token while logged into a live account, every contract placed by the auto-trader will draw directly from your real cash balance. Deriv synthetic index ticks are independent random draws; past digit frequencies visible on the heatmap don't guarantee where the next tick lands. If you connect a live token while testing a new strategy or adjusting stake multipliers, an unexpected losing sequence can drain real capital in seconds. Check your token prefix inside your Deriv settings and verify that the virtual account balance appears at the top of the interface before running any digit strategy on LDP Analyzer Pro.
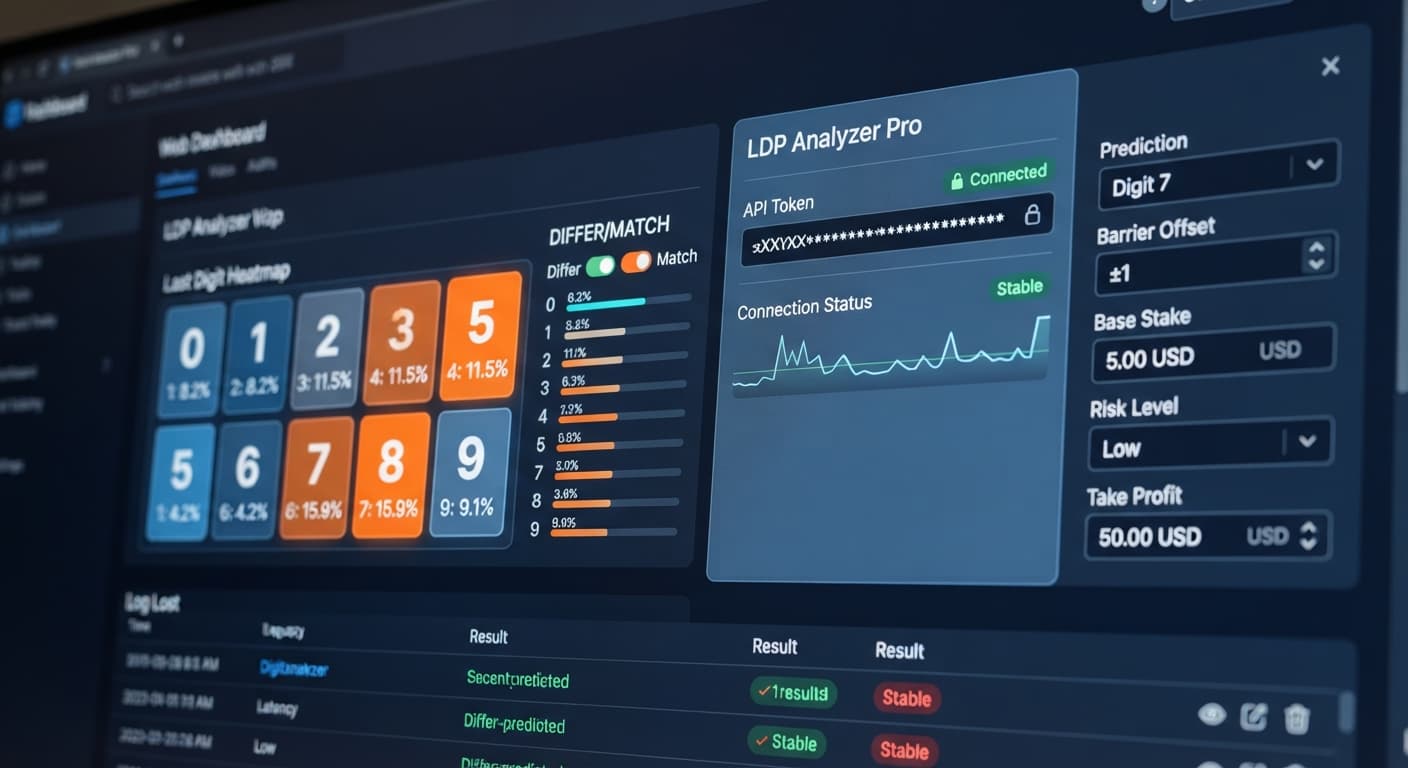
Log into your Deriv account, navigate to Account Settings > API Token, and create a new token with Read and Trade scopes while switched to your virtual account. Copy that token string, open the analyzer dashboard, paste it into the token input box, and press Connect.
Once connected, the top header bar updates to show your virtual account balance (such as $10,000.00 USD), confirming you aren't linked to real funds.
Click the market dropdown and select Volatility 100 Index. Next, select Over/Under under the strategy selection menu. Set Prediction to 3 and configure your Barrier (OVER wins > N, UNDER < N) to 3.
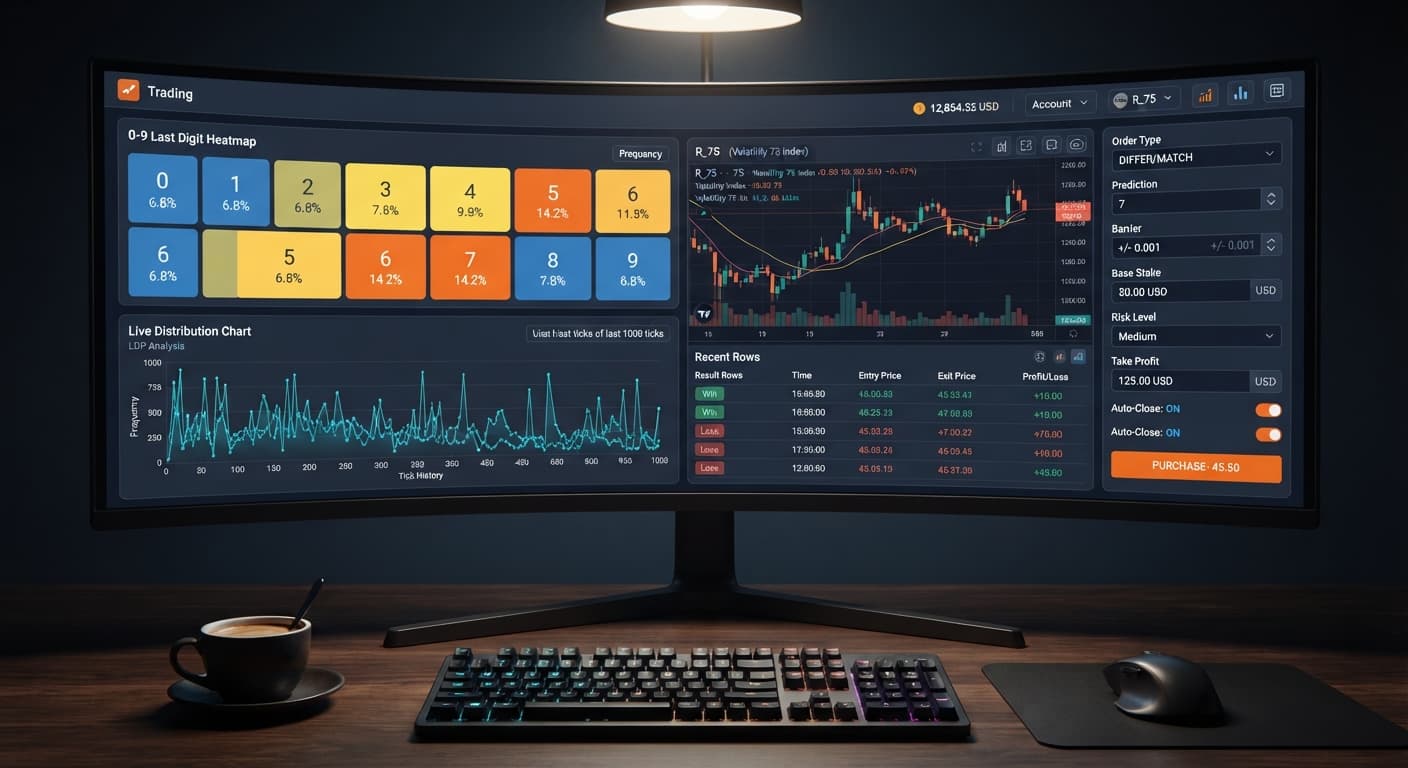
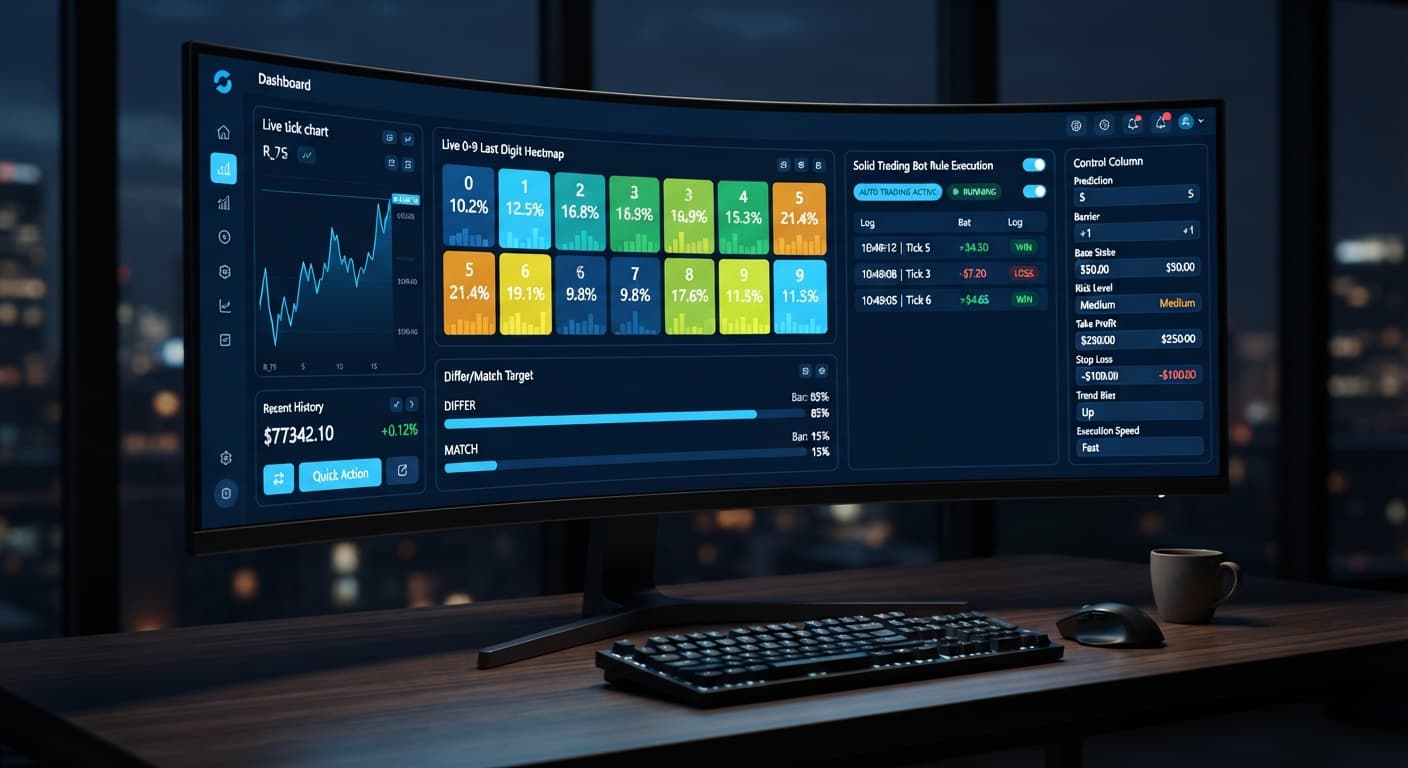
The screen updates instantly to show the live digit heatmap, highlighting the 0-9 frequency distribution in real percentages, while the entry signal gauge begins tracking DIGITOVER and DIGITUNDER probability thresholds for digits greater than 3.
In the risk panel, set Base Stake to 1.00 and Initial Stake to 1.00. Next, click the Risk Level selector and pick Moderate (2x). This setting automatically sets your Multiplier to 2x for recovery trades after a loss.
The Stake display field locks to $1.00, and the Multiplier indicator directly below the Risk Level menu displays 2.0x, confirming your stake scaling parameters.
Click the Duration (ticks) selector and choose 10 ticks from the available choices (10, 20, 30, 50, or 100). The built-in AI signals filter entries by evaluating tick momentum and digit skew, firing trades only when signal confidence clears the active threshold.
The Duration (ticks) box highlights 10, and the auto-trader status box shows that trade signals will evaluate over 10-tick windows before placing contracts.
Navigate to the exit parameter controls and enter 10.00 in Target Profit, then set Take Profit ($) to 10.00 and Stop Loss ($) to 20.00. Always define your Stop Loss ($) before starting the bot, never after trades begin running.
The parameter summary box displays a hard session ceiling at +$10.00 and a session floor at -$20.00, readying AutoPilot to run server-side trades while respecting these boundaries.
Selecting the right market directly impacts how digit strategies perform when using automated deriv bots. Different synthetic volatility indices process tick updates at varying speeds and price movement scales, altering how quickly digit frequencies shift on the live heatmap.
| Market | Tick Interval | Typical Price Movement | Digit Spread Behavior | Suitable Duration (ticks) |
|---|---|---|---|---|
| Volatility 10 Index | 2.0 Seconds | Small / Smooth | Slow digit rotation | 30 or 50 Ticks |
| Volatility 75 Index | 2.0 Seconds | Large / Sharp | Balanced digit distribution | 10 or 20 Ticks |
| Volatility 100 (1s) Index | 1.0 Second | High / Rapid | Rapid digit turnover | 10 or 20 Ticks |
For this specific setup, Volatility 75 Index provides the cleanest environment for digit analysis. Its two-second tick interval gives the AI signal filters enough time to analyze price movement without falling behind live ticks. Volatility 10 Index updates too slowly for short-duration contracts, causing signal delays, while Volatility 100 (1s) generates rapid digit turnover that can trigger consecutive trades before previous contracts settle on slower internet connections.
Once you complete a 20-trade demo session, inspect your trade log before making any changes. Experienced traders look at specific operational metrics rather than focusing solely on short-term win rates.
Here are three practical adjustments to consider after reviewing your test run:
Test your strategy settings on LDP Analyzer Pro using a demo balance first.
If you don't have an account yet, create a free Deriv account to start practicing on virtual funds.
Trading involves risk. Past performance does not guarantee future results.
Related: LDP Analyzer Pro for Beginners: Zero Experience Guide
Related: Why LDP Analyzer Pro Is Not Working on Deriv Bots
Related: Step-by-Step Guide on How to Use LDP Analyzer Pro for Deriv Bots
A fast Deriv digit-analysis tool and trading bot with a live 0-9 last-digit heatmap, DIFFER/MATCH targets, even-odd and over-under signals, and a 3-strategy auto-trader with risk controls.
Open LDP Analyzer Pro →You need to create a virtual API token inside your Deriv account settings and connect that key to the LDP Analyzer Pro dashboard. Make sure you are logged into your virtual account so you don't accidentally link a live cash balance.
Check your token prefix inside your Deriv settings and verify that your virtual account balance appears at the top of the LDP Analyzer Pro interface before running any strategy. If you connect a live token by mistake, contracts placed by the auto-trader will draw directly from your real cash.
You need to create a new token with both Read and Trade scopes while switched to your virtual account. Once you copy and paste that token into the analyzer dashboard and press connect, your virtual account balance will update in the top header bar.
You select Over/Under in the strategy menu, set your prediction and barrier, and then configure your base stake and risk level controls. You should also define your Take Profit and Stop Loss limits in the exit parameter controls before turning on automated triggers.
Guides closest to this one.
Compare ldp analyzer pro vs solid trading bot on Deriv synthetic indices. Learn live 0-9 heatmap analysis versus rule-based execution. Test it today.
Read our ldp analyzer pro review to evaluate the 0-9 heatmap accuracy, digit analysis features, and risk controls for Deriv synthetic indices.
Complete ldp analyzer pro api token setup guide for Deriv bots. Learn secure browser-based digit analysis and last digit prediction today.