Digit Analysis
LDP Analyzer Pro Deriv Bots Guide: Set Up AutoPilot
Follow this ldp analyzer pro deriv bots guide to configure AutoPilot and risk controls for precise digit analysis on Deriv. Start trading smarter today.
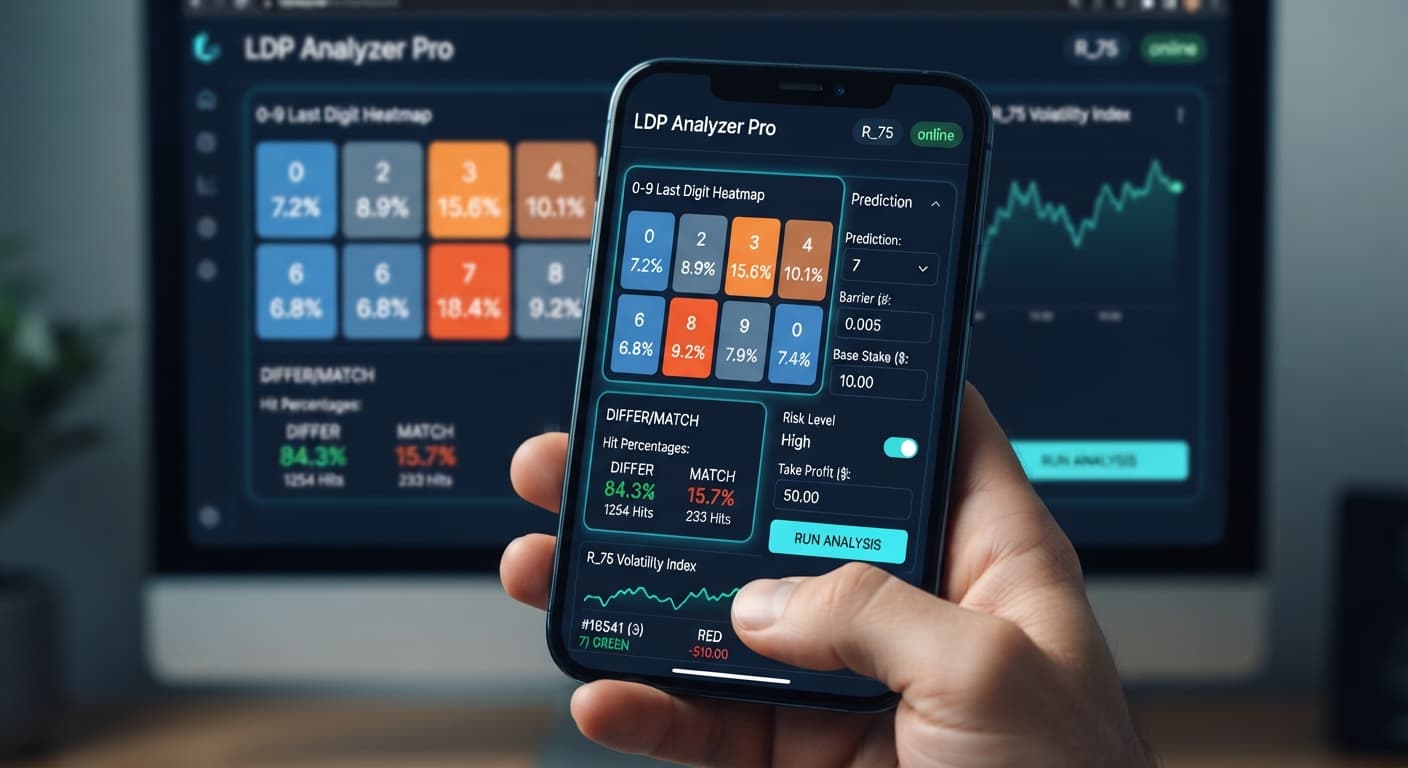
Using ldp analyzer pro for beginners comes down to understanding two core functions: reading the live digit heatmap to spot statistical distribution across synthetic tick streams, and applying structured execution rules on a Deriv demo account before running automated trades. This guide walks you through reading signal percentages, picking safe control parameters, and running your first automated test without burning real balance. You don't need any prior scripting knowledge because the tool connects directly to Deriv over their official API and executes trades automatically based on the rules you select.
If you're completely new to automated tools, testing LDP Analyzer Pro on virtual funds first lets you see how the software interacts with market volatility without financial pressure.
The tool works as a bridge between Deriv's live price feeds and your trading account. Instead of forcing you to place trades manually on the broker chart, it reads the tick stream in real time, breaks down the last digit of every price tick, and updates visual indicators instantly.
Here is what the interface is doing while you watch the screen:
Here is what it isn't doing: it doesn't hold your account balance, and it can't predict the future. Deriv synthetic index ticks are independent random draws. A digit that appeared five times in a row has the exact same mathematical probability of appearing on the next tick as any other digit. The software organizes recent data so you can execute structured rules, but past performance never alters future tick probabilities. Popular binary bots automate trade execution, but they don't change how synthetic index volatility works.
When you load the dashboard, the interface gives immediate visual feedback on market activity and system health. Knowing how to read these visual states keeps you from executing trades during connection drops or poor market conditions.
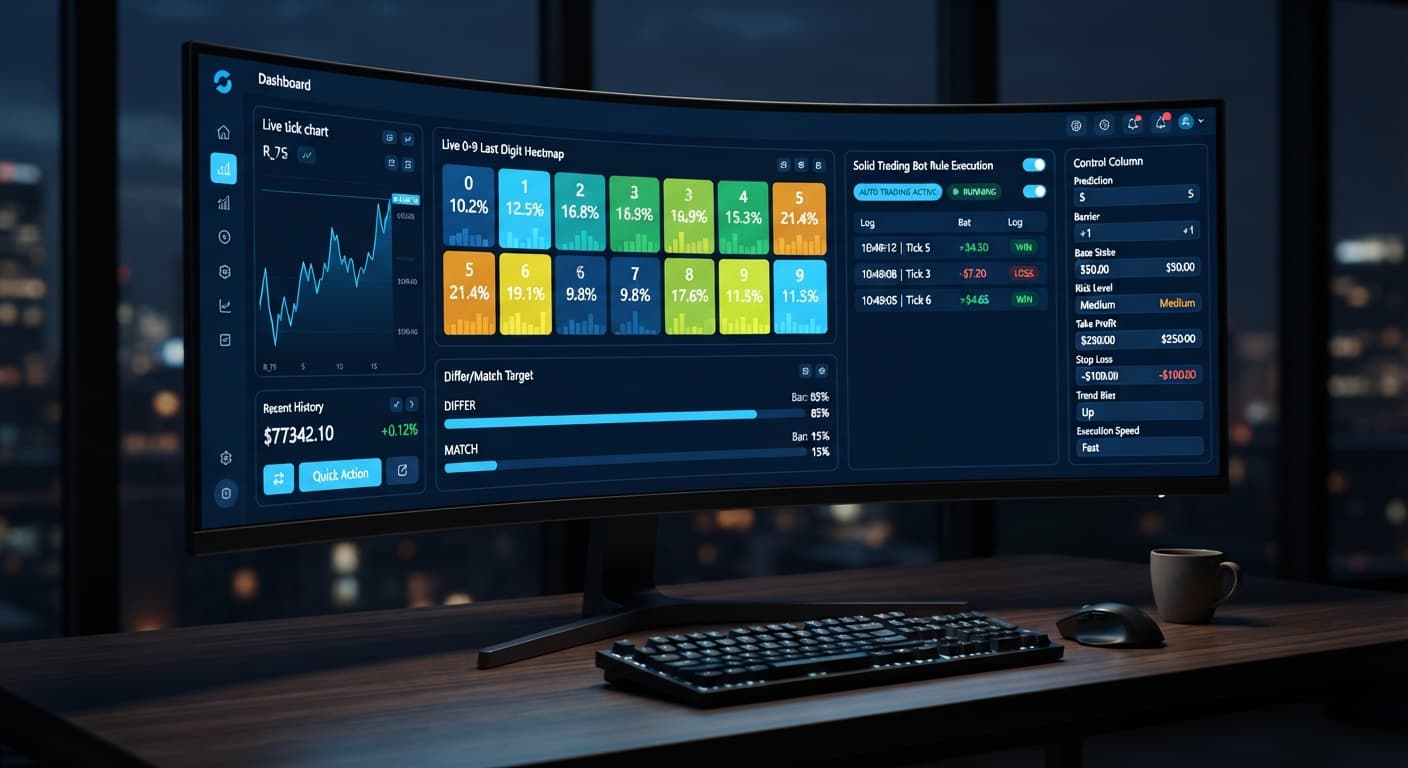
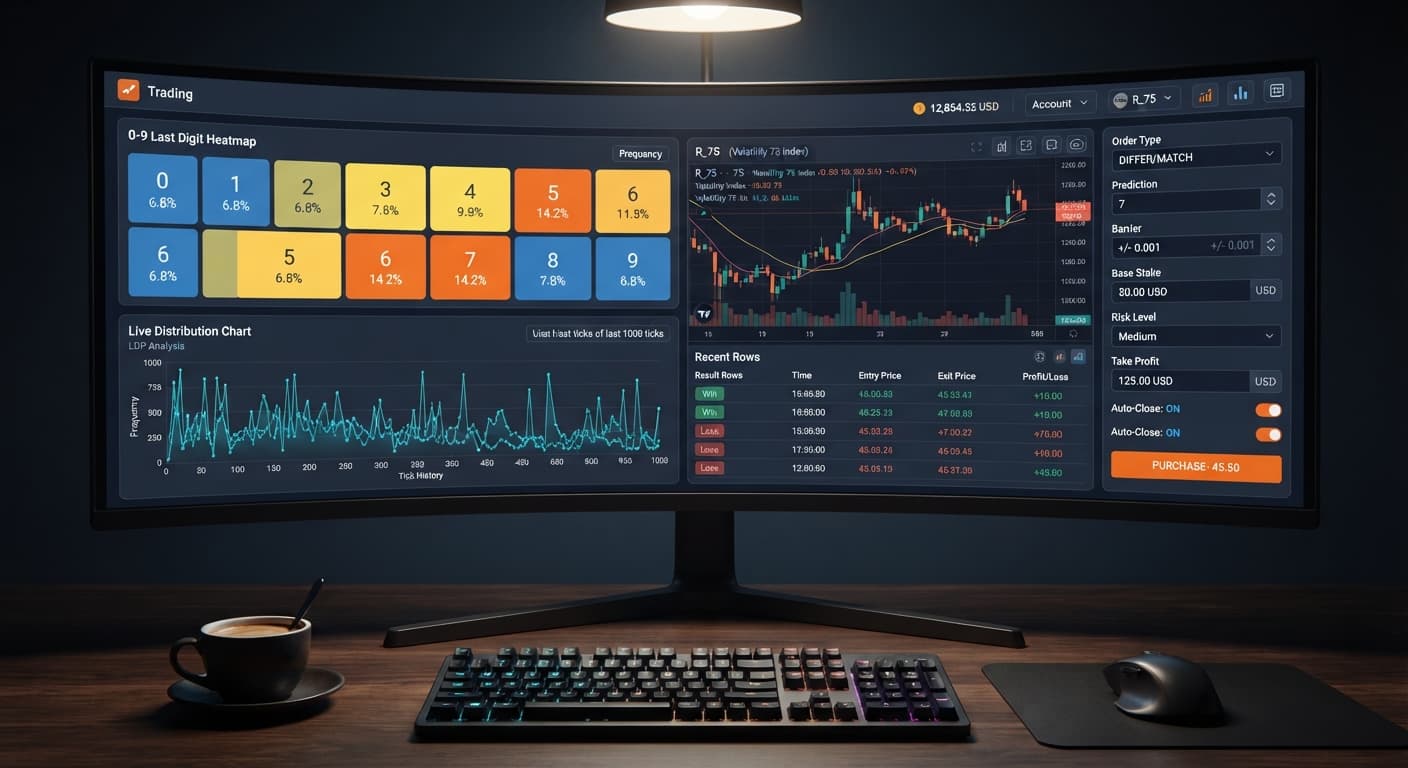
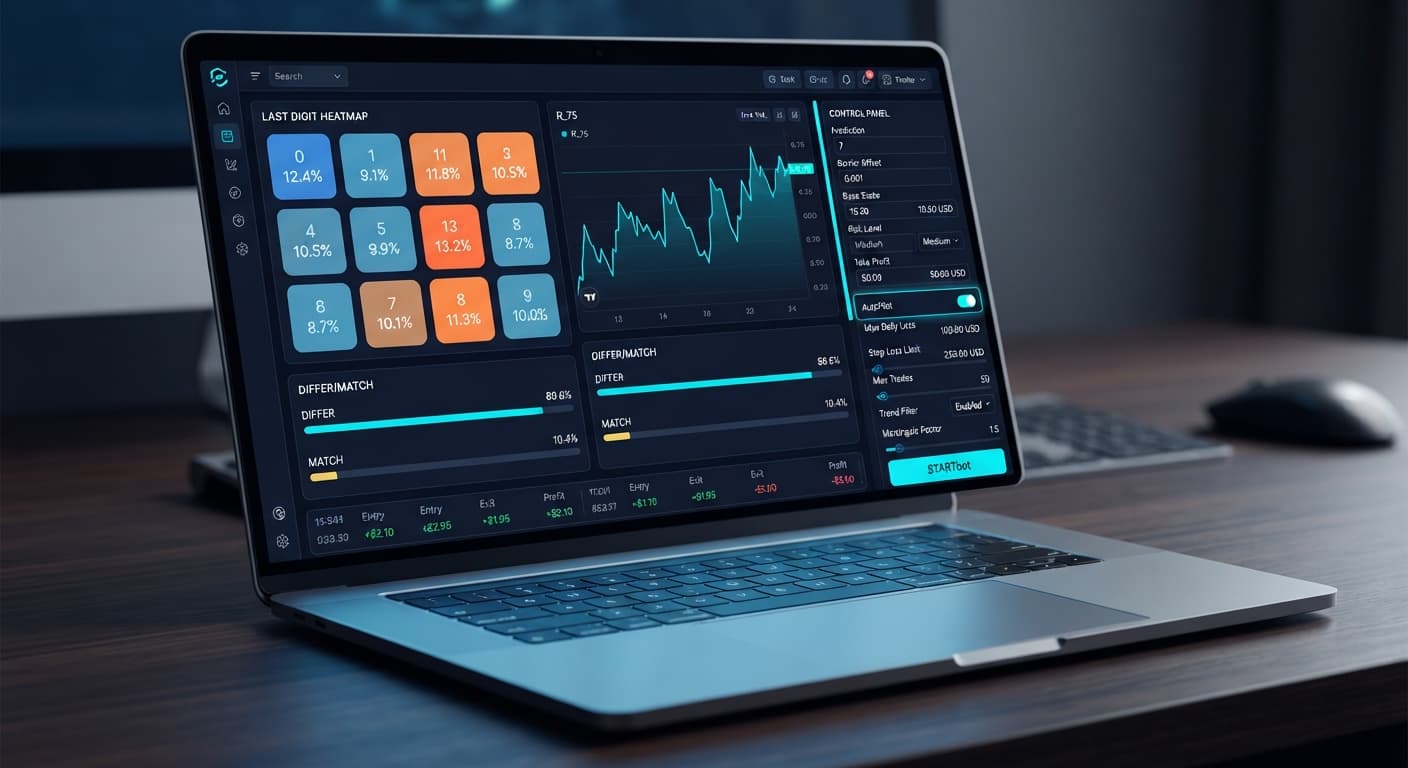
The 0-9 digit heatmap updates live with every incoming tick. Each number displays its percentage of total occurrences within the active sample. When a digit spikes in frequency, the display highlights that cell, letting you spot distribution imbalances instantly. Beside the heatmap, DIFFER and MATCH targets show their calculated hit percentages based on recent ticks.
Signal confidence panels evaluate active conditions. When confidence passes the minimum threshold, the indicator changes state to signal an entry. If the market is flat or ticks arrive out of sequence, the signal indicator pauses trade generation.
| What You See On Screen | What It Means | Required Action |
|---|---|---|
| Heatmap cell highlighted with top percentage | Digit has appeared most frequently in the current tick sample | Note the bias for Match/Differ strategies; don't assume the streak continues |
| Heatmap cell highlighted with lowest percentage | Digit has appeared least frequently in the recent stream | Evaluate for Over/Under or Differ entries based on your active rule |
| Status reads "Waiting for Signal" | AI confidence threshold hasn't been met | Let the analyzer run; don't force manual entries |
| Trade log shows yellow or red timeout warning | API data stream stalled between browser and Deriv | Re-enter your Deriv API token or refresh the workspace |
| AutoPilot status reads "Active (Server-Side)" | Automated trading is running on server architecture | You can safely close your browser tab without interrupting trades |
Monitoring these states teaches you how ldp analyzer pro for beginners processes incoming tick speeds across different indices like Volatility 100 or Vol 10 (1s).
Before running any strategy, set up your workspace using a virtual account. Following these exact steps helps you understand how settings interact before real funds are at risk.
Log into your Deriv account, create an API token with read and trade scope, and paste it into the connection box. Select your demo account balance from the top dashboard menu. The connection status indicator should turn green, displaying your virtual USD balance.
Choose your index from the market dropdown. Options include Volatility 10, Volatility 25, Volatility 50, Volatility 75, Volatility 100, or their 1-second variants like Vol 75 (1s). Next, set Duration (ticks) to your preferred count. You can select 10, 20, 30, 50, or 100 ticks. Short tick durations like 10 ticks resolve quickly, making them ideal for rapid testing on demo.
Select your mode: Over/Under, Even/Odd, Match/Differ, Rise/Fall, or AutoPilot. Adjust the on-screen parameters to control how trades trigger:
Click start or enable AutoPilot. The tool evaluates live digits against your parameters and places trades automatically. Watch the trade log populate with order types like DIGITDIFF, DIGITEVEN, or DIGITOVER. The log confirms contract entry price, contract ID, and payout outcome on every tick resolution.
Knowing when to halt automated execution is just as critical as knowing how to start it. Automated deriv bots execute trades faster than manual traders, meaning drawdowns happen quickly if market conditions shift against your parameters.
Stop the tool immediately if any of these conditions occur:
Running ldp analyzer pro for beginners requires disciplined testing habits. Synthetic index ticks are independent draws; no digit pattern guarantees a winning trade on the next tick. Whenever you test a new duration setting or try higher volatility markets like Volatility 100 (1s), test the changes on a demo account for at least 50 to 100 ticks before using live balance. Setting strict boundaries on paper keeps your trading controlled and repeatable across all market cycles.
Test your settings risk-free on LDP Analyzer Pro using a Deriv demo balance first.
If you don't have a trading account yet, create a free Deriv account to start testing digit strategies.
Trading involves risk. Past performance does not guarantee future results.
Related: Step-by-Step Guide: Using LDP Analyzer Pro for DIFFER
Related: LDP Analyzer Pro Demo Account Setup for Deriv Bots
Related: LDP Analyzer Pro Settings: Deriv Bots Stake & Risk Guide
A fast Deriv digit-analysis tool and trading bot with a live 0-9 last-digit heatmap, DIFFER/MATCH targets, even-odd and over-under signals, and a 3-strategy auto-trader with risk controls.
Open LDP Analyzer Pro →No, you don't need any prior scripting knowledge to use LDP Analyzer Pro. The tool connects directly to Deriv via their official API and automates trades based on the rules you select.
LDP Analyzer Pro acts as a bridge between Deriv's live price feeds and your trading account. It reads the tick stream in real time, processes the last digit of every price tick, and transmits orders directly to your account.
Yes, you can test LDP Analyzer Pro on a Deriv demo account using virtual funds. This lets you see how the software interacts with market volatility without any financial pressure on your real balance.
No, LDP Analyzer Pro can't predict the future because Deriv synthetic index ticks are independent random draws. The software simply organizes recent tick data so you can execute structured rules.
Guides closest to this one.
Follow this ldp analyzer pro deriv bots guide to configure AutoPilot and risk controls for precise digit analysis on Deriv. Start trading smarter today.
Compare ldp analyzer pro vs solid trading bot on Deriv synthetic indices. Learn live 0-9 heatmap analysis versus rule-based execution. Test it today.
Read our ldp analyzer pro review to evaluate the 0-9 heatmap accuracy, digit analysis features, and risk controls for Deriv synthetic indices.