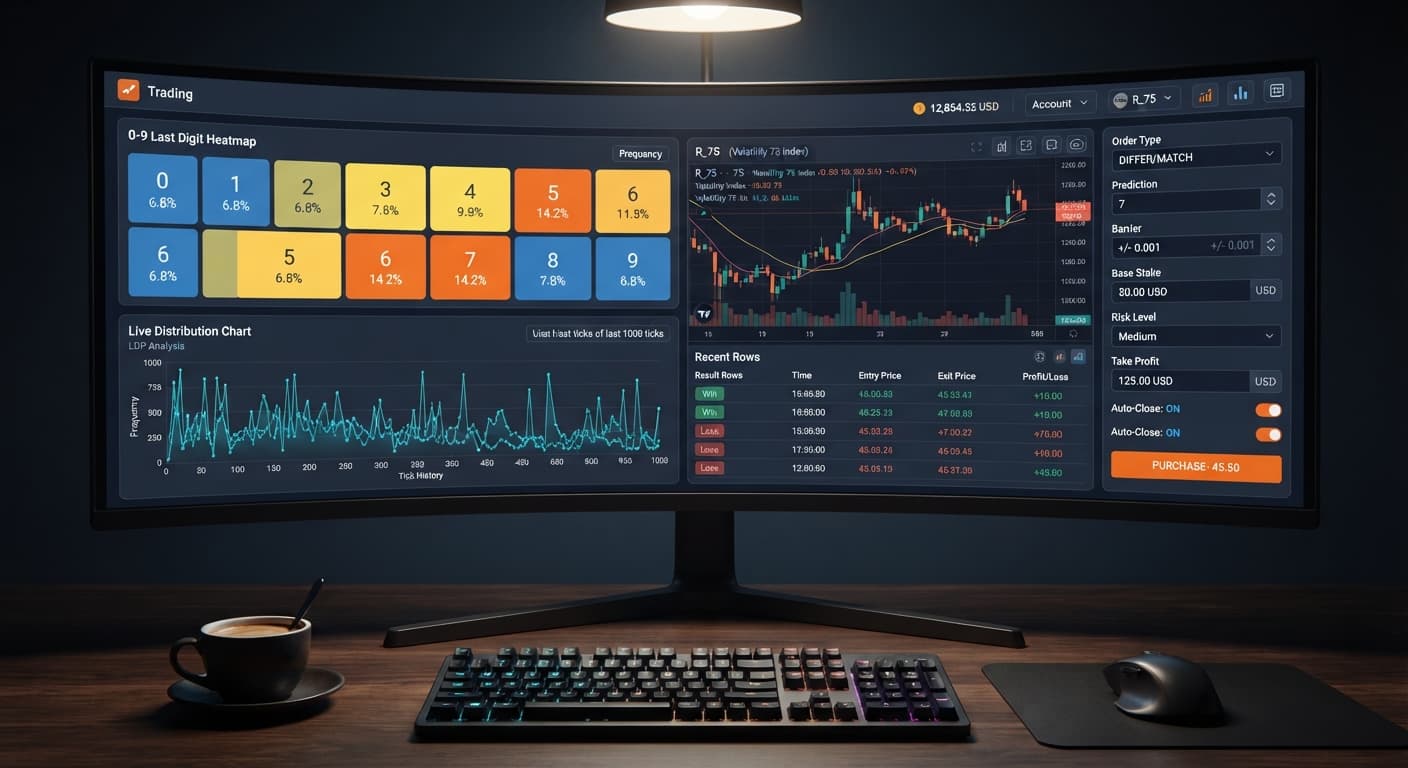
Digit Analysis
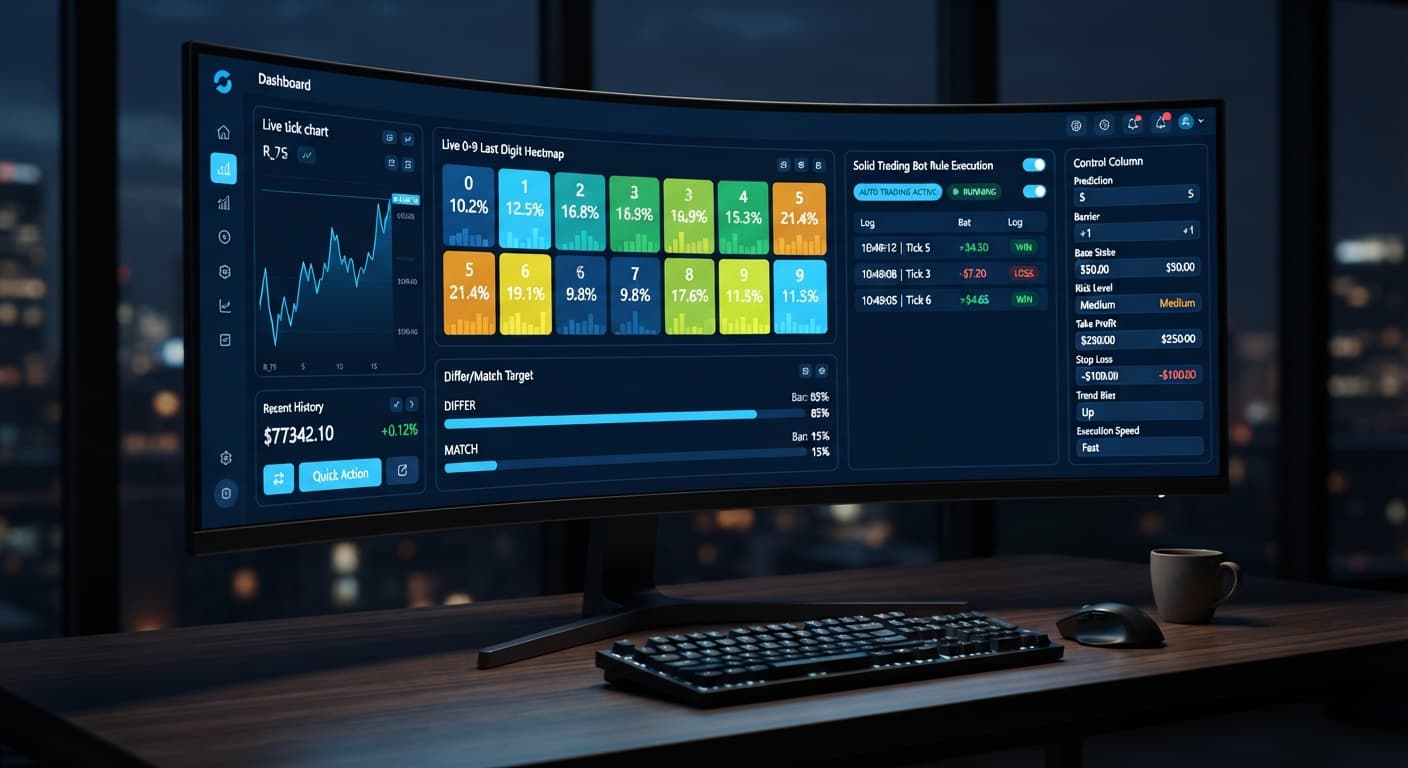
LDP Analyzer Pro vs Solid Trading Bot on Deriv Bots
Compare ldp analyzer pro vs solid trading bot on Deriv synthetic indices. Learn live 0-9 heatmap analysis versus rule-based execution. Test it today.
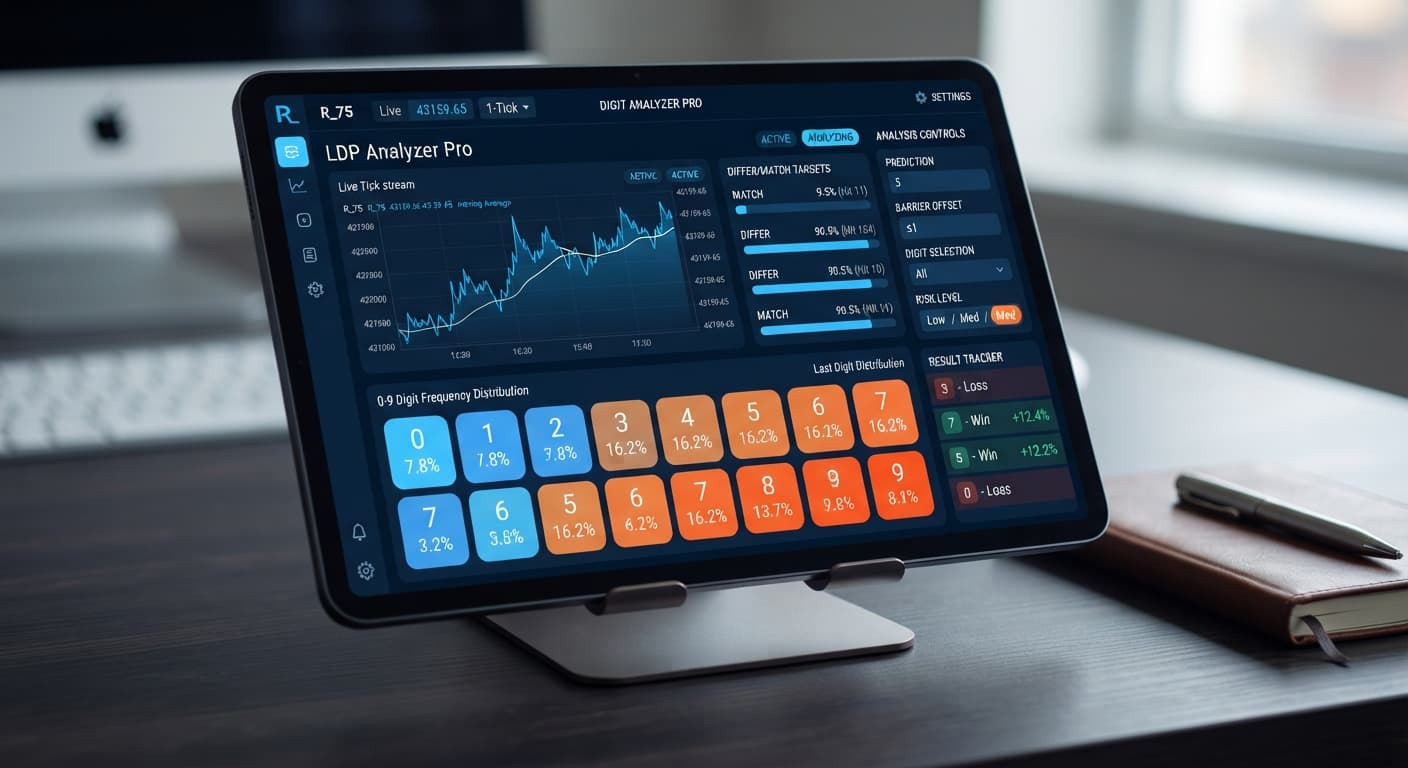
If you're looking for the ldp analyzer pro best market, the direct answer comes down to execution speed and strategy type. For high-frequency modes like Match/Differ, Vol 100 (1s) and Vol 10 (1s) are the top choices because they generate ticks every single second, letting you gather statistically useful sample sizes in under two minutes. If you run Over/Under or Even/Odd strategies on LDP Analyzer Pro, standard Volatility 75 or Volatility 100 provides cleaner digit separation without the rapid noise that triggers false signal spikes.
Selecting the right synthetic market isn't about finding a secret market that wins more often. Deriv's underlying algorithms ensure that every digit from 0 through 9 has an equal statistical probability on any given tick across all volatility indices. What changes between markets is tick speed and price movement dispersion. When configuring web-based deriv bots, matching your trade duration to the speed of the underlying asset makes the difference between an entry that fires on fresh heatmap data and one that lags behind.
Before picking a market on your dashboard, you need to understand the underlying payout math. Every digit contract on Deriv carries a built-in mathematical house edge. You won't beat that edge by simply switching indices, but knowing the exact break-even percentages helps you set realistic risk limits.
Take a DIGITDIFF contract as an example. You pick a target Prediction digit from 0 to 9. If the final tick ends on any of the other nine digits, you win.
Here is how the arithmetic works out on a standard account:
Base Stake yields a total payout of $10.95 (a $0.95 profit, or 9.5% return).Because the required break-even rate (91.32%) is higher than the true mathematical probability (90.00%), running DIGITDIFF indefinitely without entry filters results in a negative expected value.
Now look at DIGITEVEN or DIGITODD:
Base Stake yields a total payout of $19.60 (a $9.60 profit, or 96.0% return).For DIGITOVER with a Barrier set at 3:
Base Stake yields roughly $16.10 total payout ($6.10 profit, or 61.0% return).No matter which asset you select when evaluating the ldp analyzer pro best market, these payout ratios stay fixed relative to the broker's margin. The tool's job is not to alter the odds, but to use sample windows and AI signals to locate short-term frequency anomalies before placing trades.
Deriv synthetic indices rely on a cryptographically secure pseudo-random number generator. Every tick is an independent draw. The last digit of a Volatility 100 index tick doesn't remember what the previous digit was, and it doesn't care that the digit 7 hasn't appeared in the last 30 ticks.
This independence is where many traders get confused. When you look at the live 0-9 last-digit heatmap on the analyzer dashboard, you'll frequently see digits with low hit percentages—say, digit 2 showing a 2.0% frequency over a sample of Duration (ticks) set to 50. That low percentage is a real historical record of the last 50 ticks, but it does not mean digit 2 is "due" to hit on tick 51.
So why use a digit analyzer at all?
High-frequency market modes, particularly 1-second indices like Vol 25 (1s) or Vol 75 (1s), experience fast micro-clusters where specific digit ranges appear repeatedly due to pure statistical grouping. Automating entries with binary bots during these short bursts lets you capture consecutive runs while avoiding cold digits. The heatmap gives you a live snapshot of the immediate market state, while settings like AutoPilot ensure you don't enter manually when the distribution is flat.
When setting up your session, pair your market choice with matching duration and risk parameters. Fast 1-second markets require shorter tick lookbacks, while standard volatility markets work better with extended observation windows.
| Market Selected | Recommended Mode | Duration (ticks) | Risk Level | Target Use Case |
|---|---|---|---|---|
| Volatility 100 (1s) | Match/Differ | 10 or 20 | Conservative (1.5x) | Fast execution targeting cold digits via DIGITDIFF |
| Volatility 10 (1s) | Over/Under | 20 or 30 | Moderate (2x) | Smoothing low-volatility runs with Barrier 2 or 7 |
| Volatility 75 | Even/Odd | 30 or 50 | Moderate (2x) | Standard 2-second tick balance for 50/50 contracts |
| Volatility 25 | Over/Under | 50 or 100 | Conservative (1.5x) | Long-window trend observation with low tick variance |
| Volatility 50 (1s) | Rise/Fall | 10 | Aggressive (2.5x) | Directional momentum entries based on digit spikes |
To set up your environment correctly on screen, follow these operational steps:
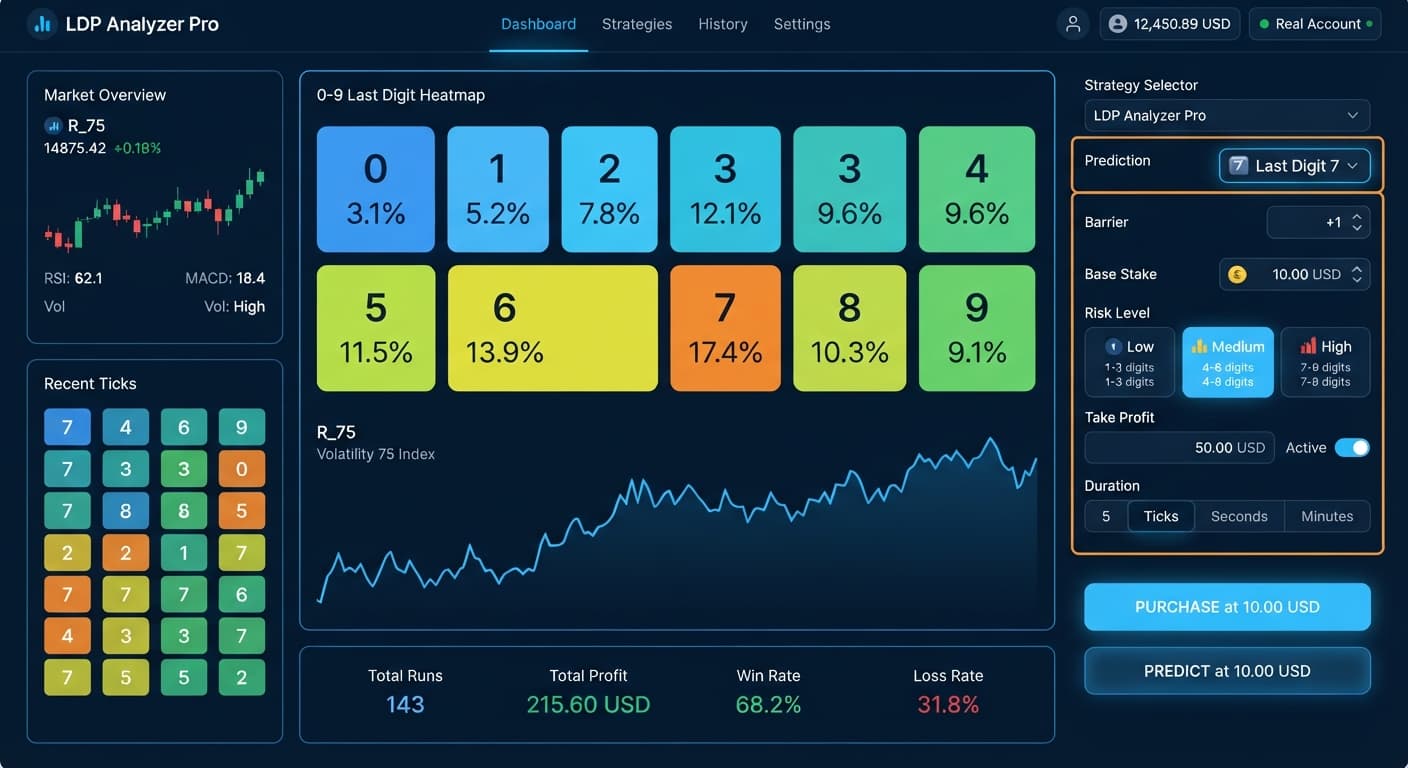
Open the dashboard controls and choose your asset from the market dropdown menu (e.g., Vol 100 (1s)). Next, pick your strategy mode from the available options: Over/Under, Even/Odd, Match/Differ, Rise/Fall, or enable AutoPilot for automated server-side execution.
Define your contract boundaries. If using Over/Under, adjust the Barrier (where OVER wins > N and UNDER < N). For Match/Differ, choose your target Prediction digit. Input your entry capital into Base Stake and Initial Stake (for instance, $2.00). Keep Stake aligned with your balance limits.
Select your preferred Risk Level to set your multiplier automatically: Conservative (1.5x), Moderate (2x), or Aggressive (2.5x). Set your exit triggers by typing precise figures into Take Profit ($) and Stop Loss ($). For example, on a $100 demo balance, you might set Take Profit ($) to 10.00 and Stop Loss ($) to 15.00.
Always set these loss limits prior to launching a session. If a strategy hits a losing sequence on a higher multiplier, your stake scales quickly. Having hard automated stop limits protects your account from catastrophic drawdowns.
Before risking real money on any asset you consider the ldp analyzer pro best market, run at least 50 automated contracts on a Deriv demo account. Verify that the AI signal confidence threshold matches your expected entry frequency, and confirm that server-side AutoPilot keeps executing cleanly without manual intervention.
To evaluate the software features and test these indices yourself, open the LDP Analyzer Pro dashboard using a practice account balance.
If you don't have a trading profile set up yet, you can create a free Deriv account to access both virtual and real WS API tokens.
Trading involves risk. Past performance does not guarantee future results.
Related: Step-by-Step Guide: Using LDP Analyzer Pro for DIFFER
Related: LDP Analyzer Pro for Beginners: Zero Experience Guide
Related: LDP Analyzer Pro Settings: Deriv Bots Stake & Risk Guide
A fast Deriv digit-analysis tool and trading bot with a live 0-9 last-digit heatmap, DIFFER/MATCH targets, even-odd and over-under signals, and a 3-strategy auto-trader with risk controls.
Open LDP Analyzer Pro →For high-frequency Match/Differ strategies, Vol 100 (1s) and Vol 10 (1s) are the top choices because they generate ticks every single second. If you're running Over/Under or Even/Odd strategies, standard Volatility 75 or Volatility 100 provides cleaner digit separation without rapid noise.
No, Deriv's underlying algorithms ensure that every digit from 0 through 9 has an equal statistical probability on any given tick across all volatility indices. Selecting a market doesn't change the odds; it only changes tick speed and price movement dispersion.
The break-even hit rate for a standard DIGITDIFF contract is 91.32%. Because this required rate is higher than the true mathematical probability of 90.00%, running it indefinitely without entry filters results in a negative expected value.
LDP Analyzer Pro doesn't alter the fixed payout ratios or change the broker's house edge. Instead, the tool uses sample windows and AI signals to locate short-term frequency anomalies before you place your trades.
Guides closest to this one.
Compare ldp analyzer pro vs solid trading bot on Deriv synthetic indices. Learn live 0-9 heatmap analysis versus rule-based execution. Test it today.
Read our ldp analyzer pro review to evaluate the 0-9 heatmap accuracy, digit analysis features, and risk controls for Deriv synthetic indices.
Master ldp analyzer pro settings for Deriv bots. Learn how to configure stake, risk level, and duration for precise digit analysis. Get started today.