Digit Analysis
LDP Analyzer Pro API Token Setup for Deriv Bots
Complete ldp analyzer pro api token setup guide for Deriv bots. Learn secure browser-based digit analysis and last digit prediction today.
This tutorial walks you through setting up automated DIGITDIFF trades on Deriv using statistical last digit prediction. You will learn how to read the live 0-9 heatmap inside LDP Analyzer Pro, pick an entry target based on real-time digit frequency, and execute trades with hard risk boundaries.
By the time you finish reading, you'll have a fully configured session running on a virtual account. You will know how to set your stake progression, configure automatic stop conditions, and avoid the common statistical traps that cause traders to clear out their accounts.
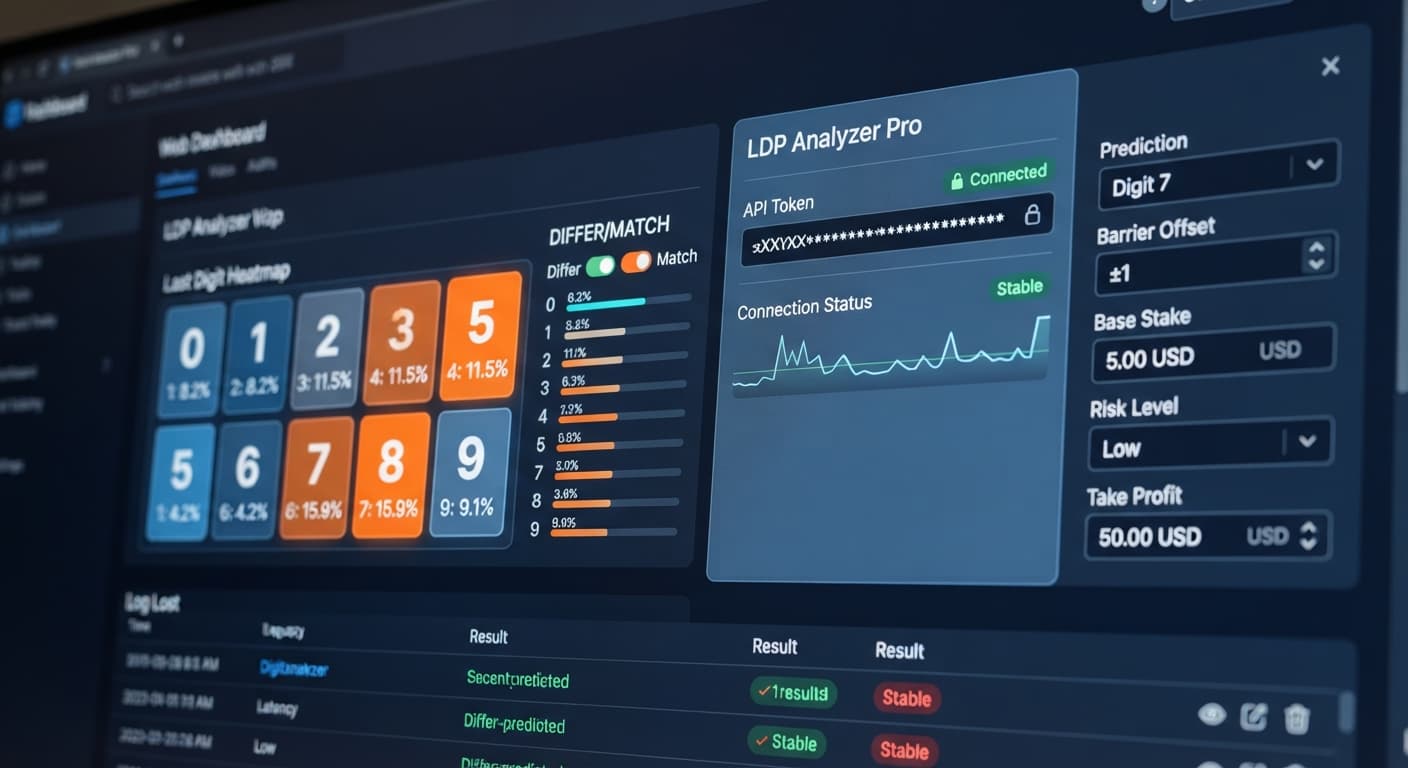
Open the analyzer dashboard and enter your Deriv API token into the prompt. The platform connects directly to Deriv over their official API. No funds are stored on the analyzer itself; every contract executes inside your personal Deriv account.
Once your account connects, locate the market dropdown menu at the top of the workspace. Select Volatility 100 or Vol 100 (1s). Synthetic index markets run 24 hours a day with constant tick generation, giving you an uninterrupted stream of prices for live digit analysis.
After selecting your market, watch the chart area for two seconds. You should see live tick prices updating immediately, accompanied by a dynamic stream of blue and grey digit counters on the right side of the screen.
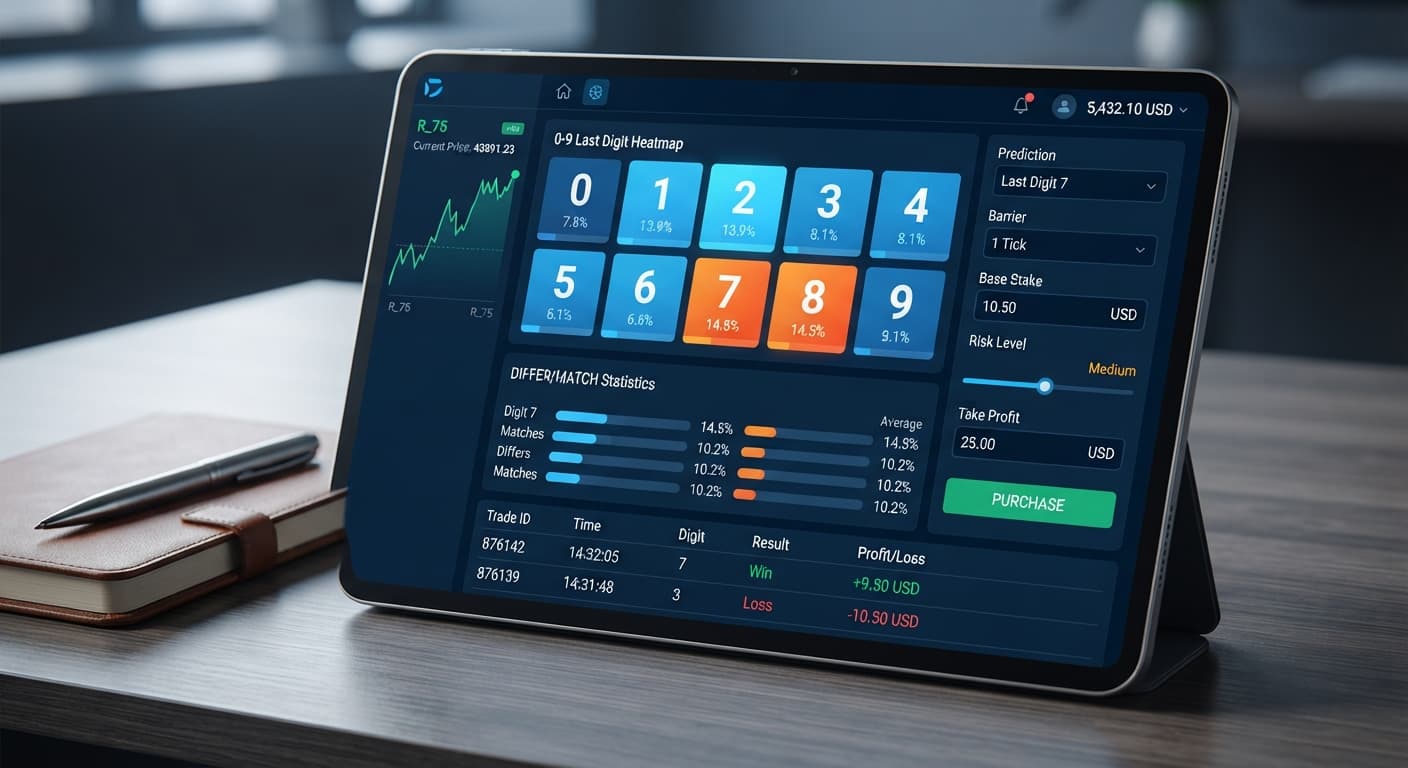
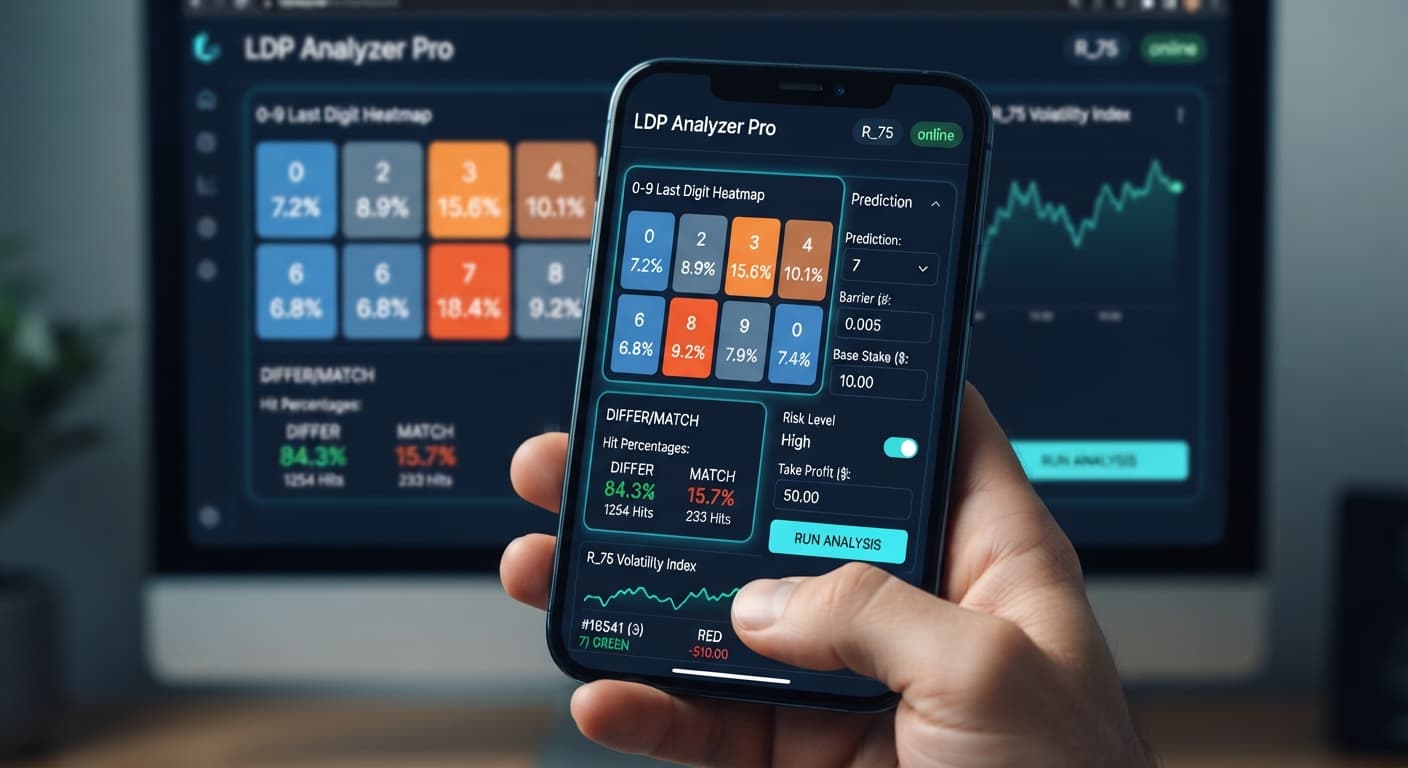
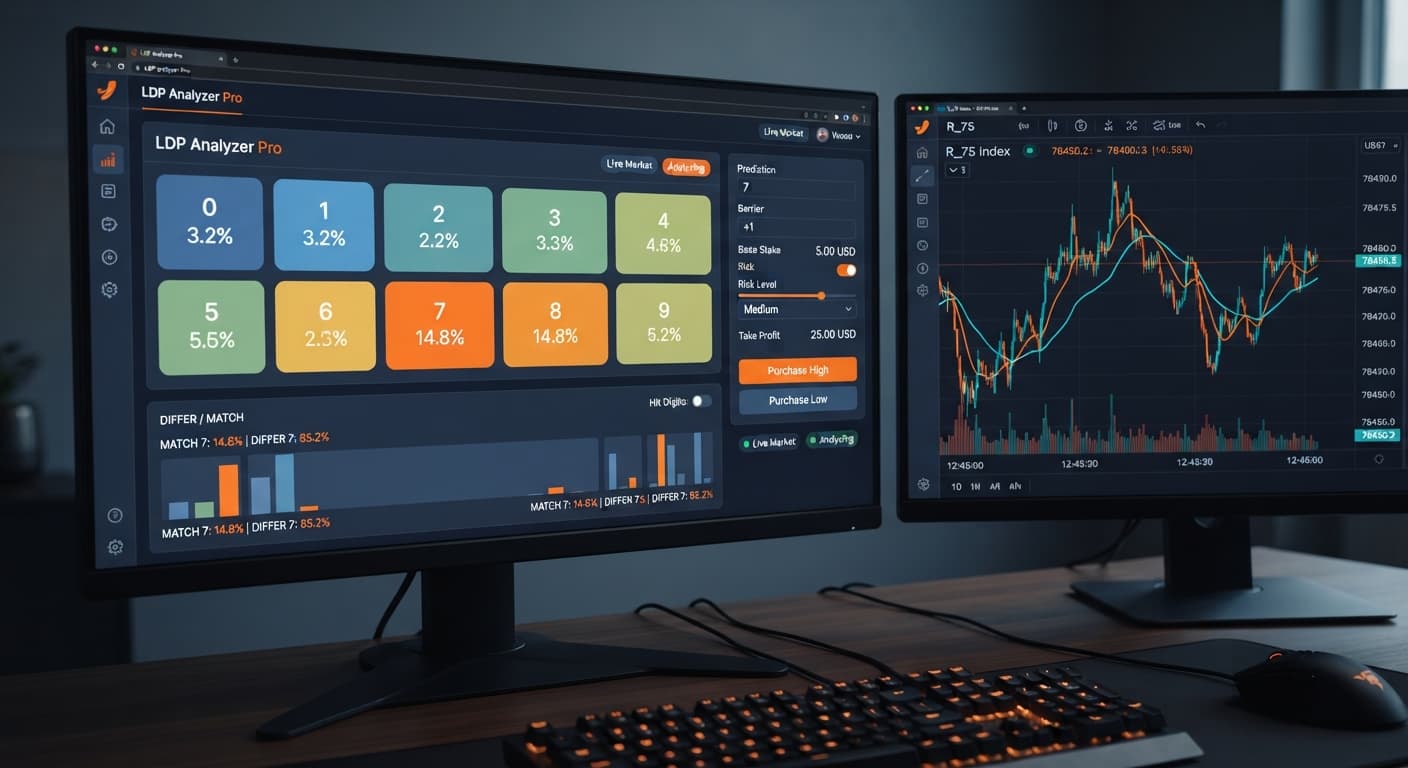
Look at the live 0-9 digit heatmap display. The visual layout breaks down the percentage distribution of the last digit across recent ticks. You will see percentages attached to each digit from 0 through 9, highlighting high-frequency targets in bright colors and low-frequency numbers in dark tones.
When trading a DIGITDIFF contract, you win whenever the final tick digit does not match your prediction number. For instance, if you predict 4, any tick ending in 0, 1, 2, 3, 5, 6, 7, 8, or 9 pays a winning return.
Find the digit showing the lowest percentage on the heatmap. If the digit 7 currently sits at a 3.2% occurrence rate while every other digit averages 10% to 12%, type 7 directly into the Prediction field.
Keep this reality in mind: synthetic indices on Deriv use independent random draw generators. A digit appearing rarely in the last 100 ticks is not mathematically prohibited from appearing on the next tick. The binary analysis tool maps history, not future certainties.
Navigate to the strategy mode selector and switch the drop-down to Match/Differ. Setting this mode forces the underlying trade engine to send DIGITDIFF contracts to your account.
Next, find the control labeled Duration (ticks). Select 10 from the available preset choices (10, 20, 30, 50, or 100).
A 10-tick duration offers a balanced timeframe for evaluating statistical variance. Shorter durations process results quickly, but longer runs smooth out sudden micro-spikes in digit repetition. Once you select 10 ticks, the dashboard confirms your trade contract format as a 10-tick DIGITDIFF position against your selected Prediction digit.
Locate the financial parameters on the control panel. Enter your baseline monetary commitment into the Base Stake and Initial Stake input fields. If your session balance is $100, enter $1.00 into both boxes.
Now choose your stake multiplier using the Risk Level setting:
Select Conservative (1.5x).
Because DIGITDIFF contracts carry a high win probability per tick (roughly 90%), payouts are low—typically paying back around 9.9% profit on a winning trade. Winning a $1.00 contract nets you roughly $0.09. Losing that $1.00 contract, however, costs you the entire $1.00.
If you use an aggressive multiplier to recover that $1.00 loss, a brief streak of consecutive losses will send your required trade size through the roof. Stick to the 1.5x conservative setting while learning the tool.
Never click the start button until you set clear session limits. Find the inputs labeled Take Profit ($) and Stop Loss ($).
If you are trading with a $100 virtual bankroll and a $1.00 Base Stake, enter these exact limits:
5.00 into the Take Profit ($) field.15.00 into the Stop Loss ($) field.These controls act as automatic circuit breakers. The platform monitors your accumulated profit and drawdown in real time. The moment your net session profit touches $5.00, the system stops placing orders. If a cold streak hits and your total loss reaches $15.00, trading halts instantly.
Setting your stop loss before starting prevents emotional adjustments while a draw-down is active.
Use these initial configuration values on a virtual demo account before risking real funds.
| Setting Name | Starting Value | Purpose |
|---|---|---|
| Market | Volatility 100 | High tick frequency provides stable data updates |
| Mode / Strategy | Match/Differ | Configures contract execution to DIGITDIFF |
| Prediction | Coldest digit (e.g., 0-9) | Target the digit with lowest recent heatmap percentage |
| Duration (ticks) | 10 | Standard short-term tick window |
| Base Stake | $1.00 | Limits base exposure to 1% of a $100 bankroll |
| Initial Stake | $1.00 | Matches base stake for standard entry |
| Risk Level | Conservative (1.5x) | Prevents runaway stake growth during losses |
| Take Profit ($) | $5.00 | Stops execution at a 5% gain on session capital |
| Stop Loss ($) | $15.00 | Hard cutoff at 15% bankroll drawdown |
Trading DIGITDIFF positions feels easy because wins happen often. That high win rate creates a false sense of security. Here are the specific failure modes you will face and how to set your controls to mitigate them.
A single loss on a $1.00 DIFFER trade wipes out the profits from roughly eleven consecutive wins. If you experience three losses in a row using aggressive recovery settings, your stake sizes multiply rapidly.
With a standard 2x martingale on a $1.00 base stake, four losses look like this:
To prevent this sequence from draining your account, always set Risk Level to Conservative (1.5x) and cap your Stop Loss ($) at no more than 15% to 20% of your current balance.
It is easy to assume that because a digit has not appeared for 50 ticks, it will not appear on the next tick either. Deriv synthetic indices use random draw algorithms. Every single tick has an independent 10% chance of landing on any specific digit from 0 through 9.
Past percentage distribution displayed on the LDP analyzer heatmap helps you spot past variance, but it does not alter future probability. Mitigate this risk by enforcing strict Take Profit ($) targets instead of running the bot indefinitely.
If you run manual execution mode and your browser tab goes to sleep or loses connection, trades may fail to fire or manual stop commands may delay. If you plan to step away from your computer during a session, switch your execution mode to AutoPilot. AutoPilot runs execution logic server-side, protecting your positions even if your browser tab loses connection.
Because individual DIFFER payouts are small, traders often leave the bot running for hours to stack small gains. The longer your account stays exposed to the market, the higher the mathematical certainty that you will encounter an outlier loss streak.
Set your Target Profit or Take Profit ($) to modest numbers—around 3% to 5% of your total balance per session—and shut the platform down once you hit that target.
Try it yourself on LDP Analyzer Pro using a demo balance first.
If you don't have an account yet, create a free Deriv account to start testing digit tools.
Trading involves risk. Past performance does not guarantee future results.
Related: Step-by-Step Guide: Reading Live Ticks with LDP Analyzer
Related: How to Configure LDP Analyzer Settings on BinaryBot.live
Related: Step-by-Step Guide on How to Use LDP Analyzer Pro for Deriv Bots
A fast Deriv digit-analysis tool and trading bot with a live 0-9 last-digit heatmap, DIFFER/MATCH targets, even-odd and over-under signals, and a 3-strategy auto-trader with risk controls.
Open LDP Analyzer Pro →You need to generate a Deriv API token with both read and trade permissions checked from your account security settings. Paste that token directly into the prompt on the LDP Analyzer Pro dashboard to connect securely over the official API.
You should select Volatility 100 or Vol 100 (1s) from the market drop-down menu at the top of the workspace. These synthetic indices run 24 hours a day with constant tick generation, providing an uninterrupted stream of prices for live digit analysis.
You look at the live 0-9 digit heatmap to find the digit showing the lowest percentage occurrence across recent ticks. Once you identify that low-frequency target, type it directly into the Prediction field.
You should navigate to the strategy mode selector, switch it to Match/Differ, and set the duration control to 10 ticks from the available preset choices. A 10-tick duration offers a balanced timeframe for evaluating statistical variance while processing results quickly.
Guides closest to this one.
Complete ldp analyzer pro api token setup guide for Deriv bots. Learn secure browser-based digit analysis and last digit prediction today.
Complete ldp analyzer pro demo account setup guide for binary bots. Learn digit analysis, configure last digit prediction, and test safely on Deriv today.
Learn ldp analyzer pro for beginners with zero prior experience. Master digit analysis on Deriv bots safely. Read the complete guide today.