Digit Analysis
LDP Analyzer Deriv Bots Guide: Setup & Strategy
Read this ldp analyzer deriv bots guide to connect your token, configure digit analysis, and run automated trades safely. Start automating today.
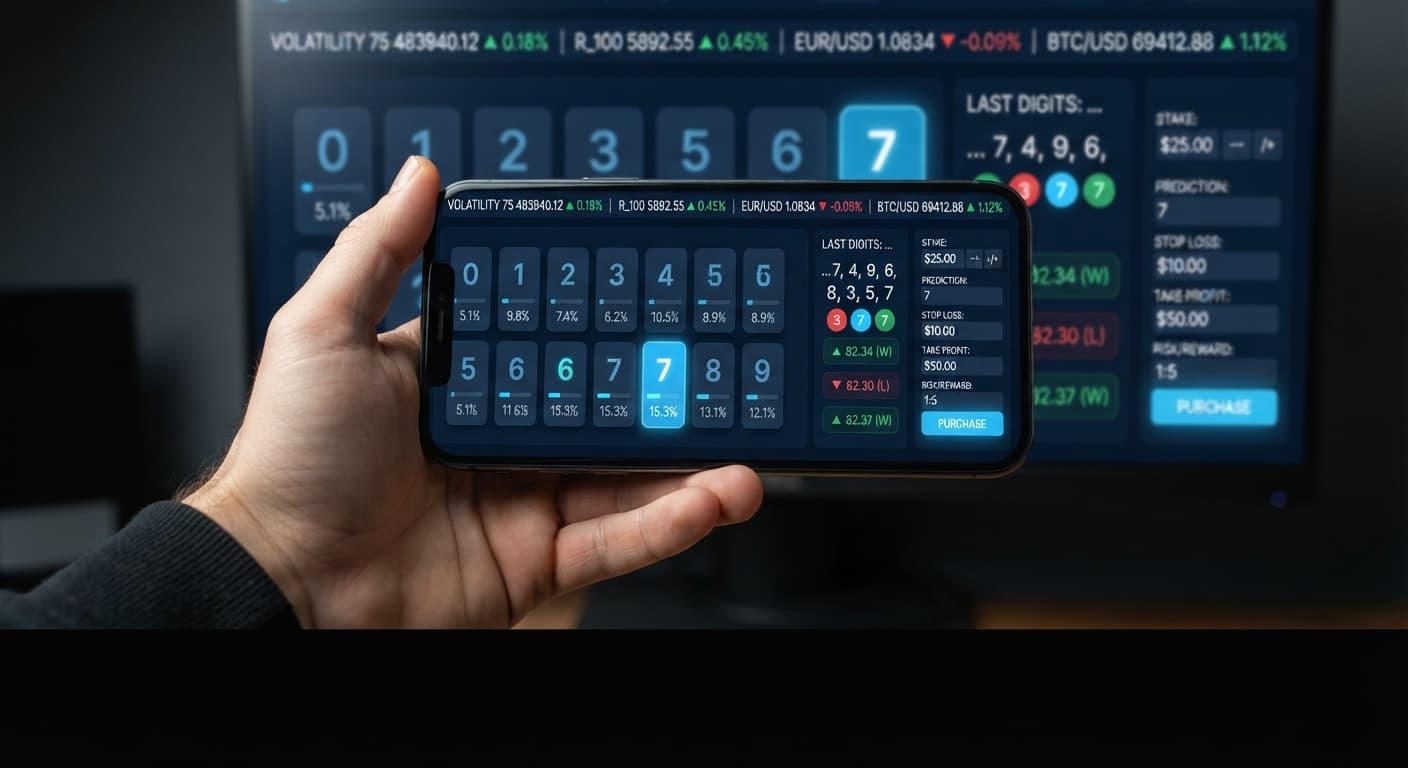
This tutorial walks you through setting up and running live tick analysis using LDP Analyzer. You will learn how to connect your Deriv trading feed, configure essential risk parameters, interpret tick streams, and execute digit trades automatically inside your browser.
By the time you finish reading, you'll have an active tick monitoring system linked directly to your Deriv demo or real account. You'll know exactly which settings to adjust, how to protect your balance, and how to avoid the common statistical traps that cause traders to drain their accounts.
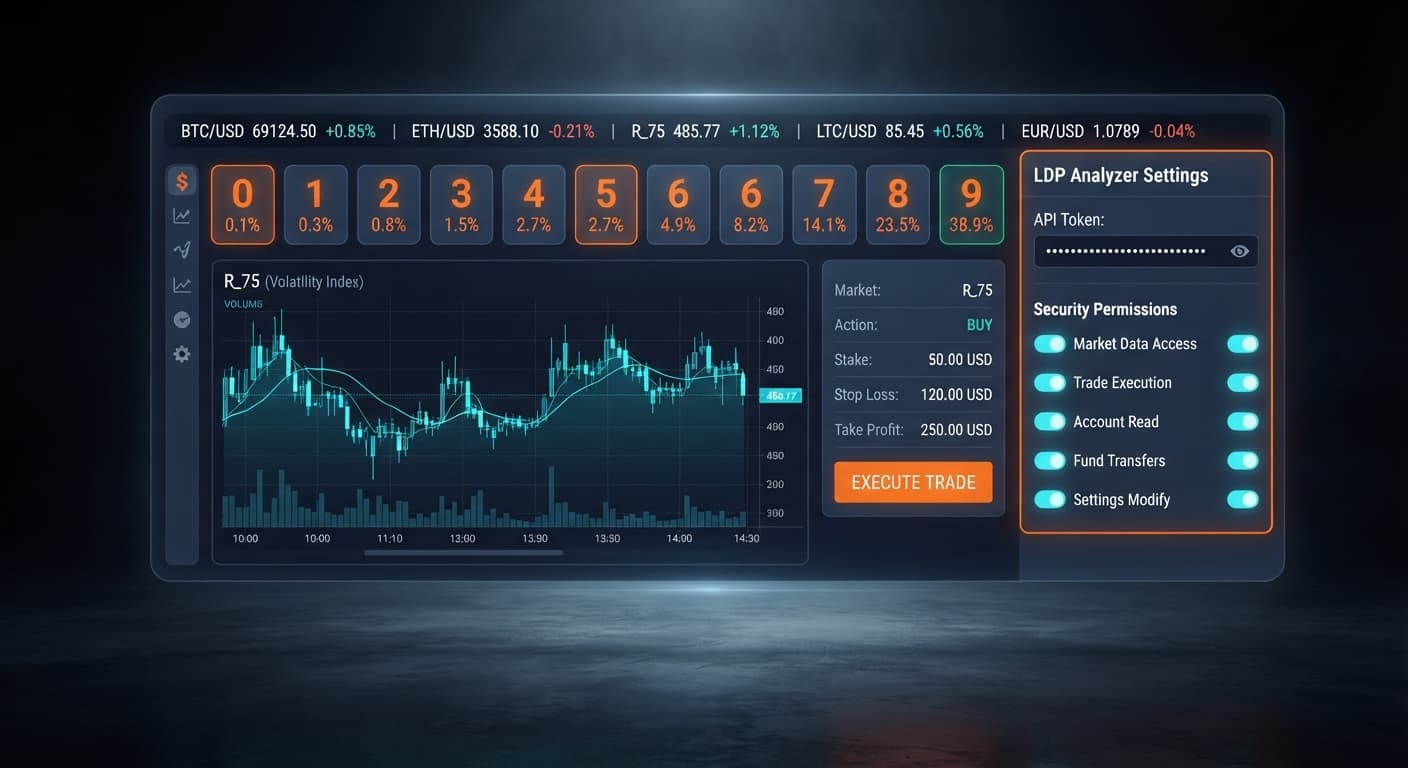
Open the interface and locate the input box labeled Deriv API token connection. This field accepts the unique security token generated inside your Deriv account security menu. Paste your token directly into the field and click connect.
Once submitted, the tool connects directly to Deriv over their official API using your personal token. No middleman servers hold your credentials or handle your account funds. If your token is valid, the interface will display your active balance, confirming that live communication with Deriv is established. If the connection fails, verify that your token includes both Read and Trade permissions in your Deriv settings.
Click on the dropdown labeled market selector. This menu controls which synthetic index stream feeds into your session. You can choose from:
Select Volatility 100 (1s) Index for rapid tick updates or Volatility 10 Index if you prefer a slower sequence. As soon as you make a selection, the tick display begins updating. Every single price tick received gets parsed, isolating the very last digit of the price in real time.
Before touching any entry controls, fill out your session risk fields. You must set these boundaries first. Entering trades without predefined exits leads straight to blown accounts.
Locate three distinct input boxes on your screen:
1.00.15.00.5.00.Setting these numbers tells the system when to shut down execution automatically. If your accumulated losses hit $15.00 or your profits reach $5.00, trading halts immediately.
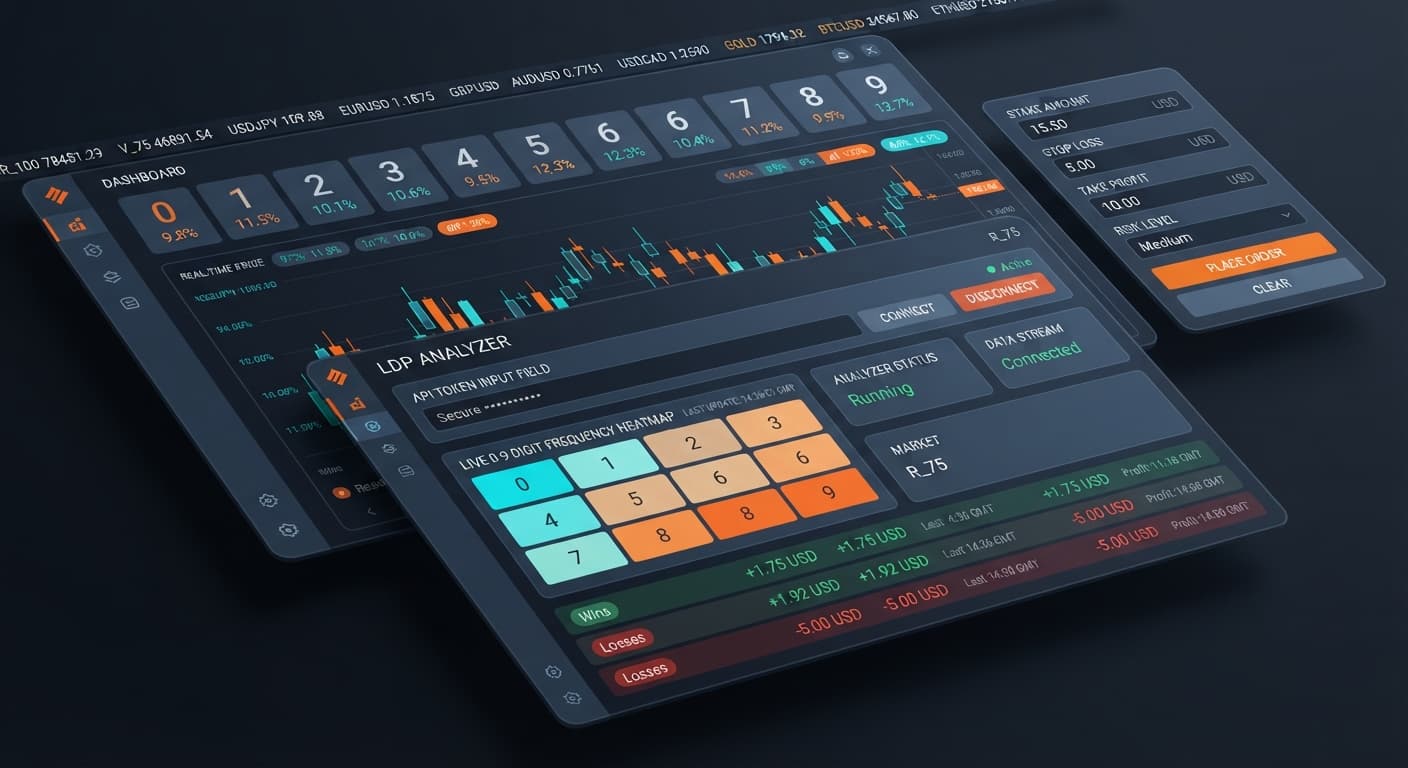
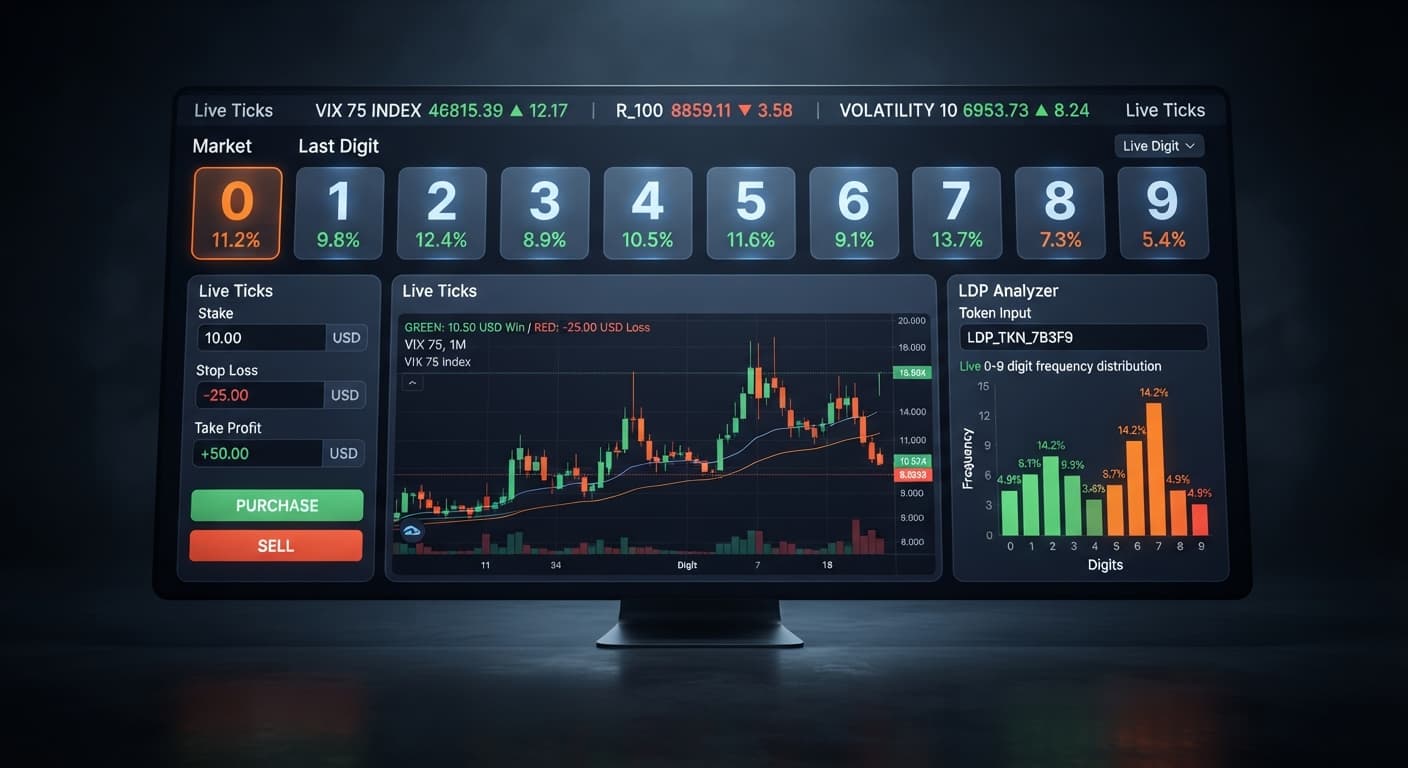
Switch your focus to the stream display driven by real-time digit analysis. This module tracks incoming price points and breaks down digit distributions as ticks land.
You can evaluate six distinct contract types supported by the system:
Keep your math straight while looking at the feed. Deriv synthetic indices are generated by cryptographic random number algorithms. Every tick is an independent draw. If you see five consecutive odd digits on the feed, the probability of the next tick being even is still exactly 50%. The market does not owe you a correction, and long sequences of identical outcomes happen constantly. Entry-level tick analysis helps you track current distribution, while advanced tools like LDP Analyzer Pro add complete 0-9 heatmaps, explicit DIFFER and MATCH targets, and an enhanced auto-trader module.
When your parameters are typed in and verified, enable automated strategy execution. The system will begin reading the incoming tick stream and submitting orders directly to your Deriv account according to your defined entry rules.
Watch the trade log as orders go through. You will see contract purchases executed for your selected market—whether DIGITEVEN, DIGITODD, DIGITOVER, DIGITUNDER, DIGITMATCH, or DIGITDIFF. Monitor the session tally against your predefined risk limits. Do not adjust your stop loss downwards while the bot is active. If the system hits your limit and stops trading, step away from the screen.
The following parameters offer a conservative baseline for testing on a $100 balance inside a Deriv demo account.
| Setting / Control Name | Baseline Value | Reason for Configuration |
|---|---|---|
| market selector | Volatility 100 (1s) | Provides rapid tick generation, allowing quick testing of API responsiveness. |
| stake | $1.00 | Keeps your single-contract exposure at 1% of your test account balance. |
| stop loss | $15.00 | Hard caps session drawdown at 15% of bankroll. |
| take profit | $5.00 | Locks in a realistic 5% account gain per session. |
Always test these baseline settings on a demo account until you understand trade frequency and execution timing.
If you run continuous doubling strategies on loss recovery, your stake explodes far faster than you anticipate. Look at the math on a standard $1 base trade:
A single streak of 8 losses costs $255.00 total. To survive this, you must define your maximum multiplier steps and enforce a hard cap using the stop loss setting before starting execution.
Traders often assume that a digit showing low historical frequency over the last 100 ticks is "due" to hit. Synthetic indices do not have memory. Past digit frequencies do not alter the outcome of the next tick. Relying on past distribution to guarantee future ticks leads to heavy losses during extended runs.
Launching automated strategy execution without entering numbers into stop loss and take profit leaves your account completely exposed. An unmonitored script running on a live connection will continue opening contracts through drawdowns until your entire account balance hits zero.
Skipping the demo phase is the quickest way to lose capital to operational mistakes. Typos in your stake or misinterpreting contract conditions on live money cause permanent losses. Always run your configuration on a virtual Deriv demo balance first to confirm that the bot behaves exactly as expected.
Try testing these parameters on LDP Analyzer using a demo balance first.
If you don't have one yet, create a free Deriv account to get started.
Trading involves risk. Past performance does not guarantee future results.
Related: Why Your Accumulator Bot Growth Rate Keeps Failing
Related: Configuring Sniper Bot V3 Virtual Trades: Beginner Guide
Related: How to Configure LDP Analyzer Settings on BinaryBot.live
Related: Using Ldp Analyzer For Beginners On Deriv Binary Bots
Free LDP Binary Analyzer — AI-powered last-digit analysis for Deriv traders with real-time binary analysis and automated strategies.
Open LDP Analyzer →You need to generate a Deriv API token with Read and Trade scopes enabled under your account settings. Paste that unique token directly into the Deriv API token connection box in LDP Analyzer and click connect to link your account.
You can choose from Volatility 10, 25, 50, 75, and 100 indices, as well as their corresponding 1-second variants. Simply use the market selector dropdown in the interface to pick your desired index feed.
Your Deriv API token must have both Read and Trade scopes enabled. If your connection fails, verify that these specific permissions are checked in your Deriv account settings before trying again.
You enter your predefined risk limits into the designated stop loss and take profit input boxes before starting your session. Once your accumulated profits or losses hit those specified dollar amounts, LDP Analyzer will halt trading automatically.
Guides closest to this one.
Read this ldp analyzer deriv bots guide to connect your token, configure digit analysis, and run automated trades safely. Start automating today.
Master ldp analyzer api token setup to connect Deriv bots for real-time digit analysis and automated binary strategy execution. Start trading today.
Use ldp analyzer india for binary bots. Learn how to connect your Deriv API token and run real-time digit analysis today. Start reading now.